Open Source Analytics for Smarter Pricing Decisions in Retail
Armin Kakas | MinneAnalytics FAR Con
August 12, 2015
Agenda
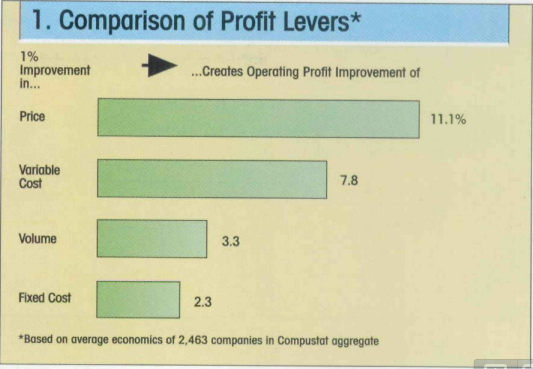
Pricing in Retail
Pricing most impactful business lever
- Smart pricing tactics > cost reduction efforts
Source: Managing Price, Gaining Profit
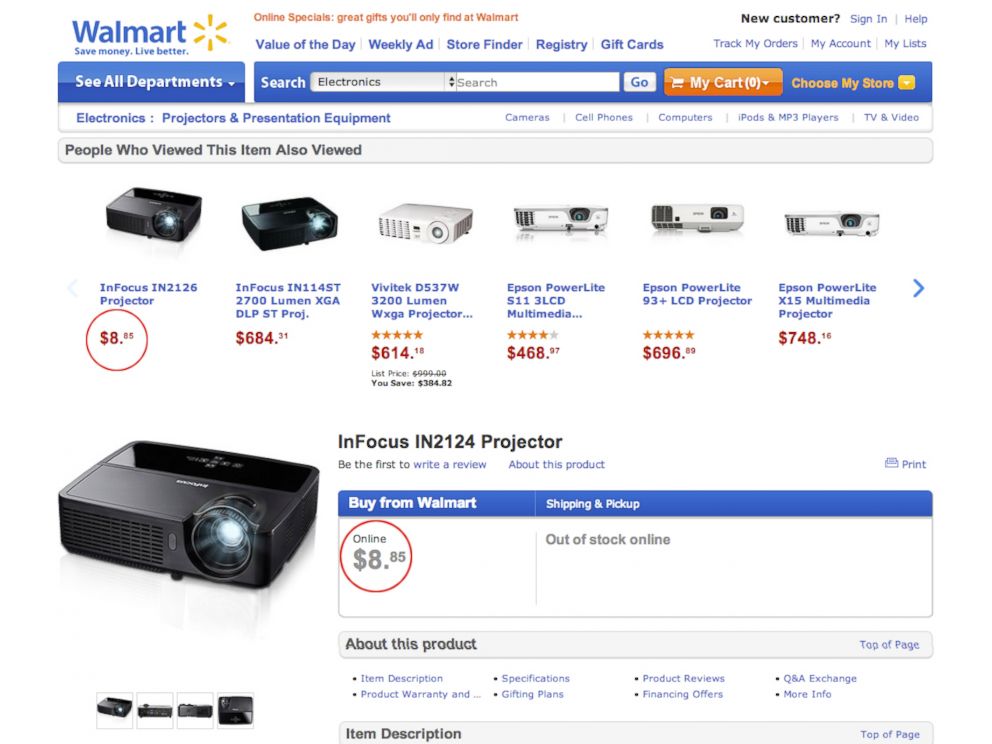
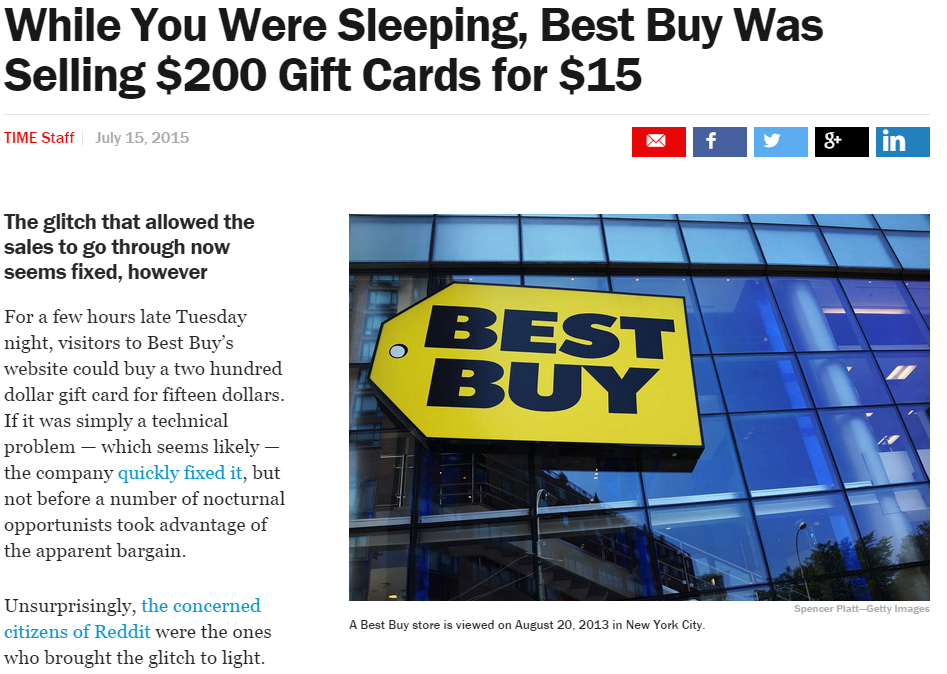
Let's look at some real world examples
How things looked in 2014

...with X % improvement in COGS or prices

Who "owns" pricing?
What is the right pricing strategy?
Remember the long-tail?

Key pricing considerations
Strategic
What pricing changes would you make?

Don't depart from core pricing strategy
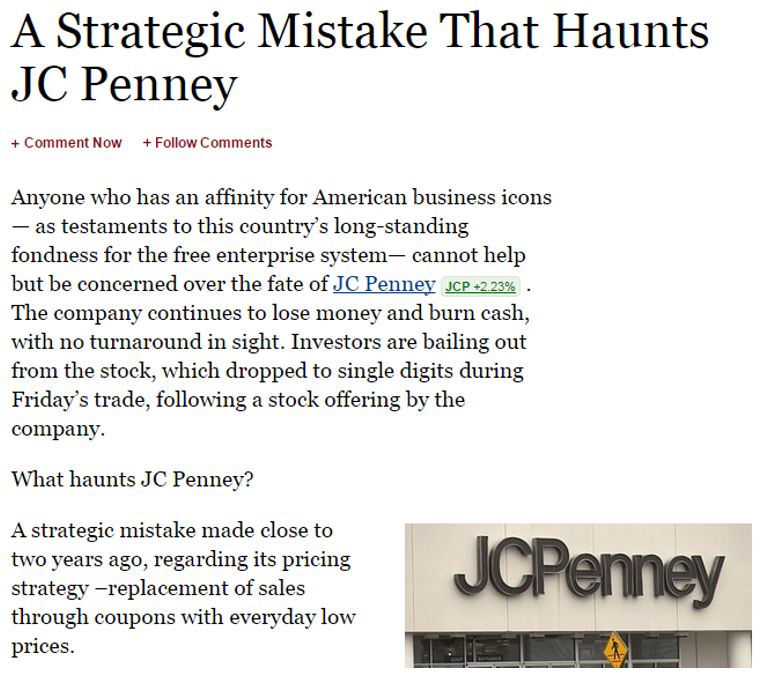
Price match guarantees are effective
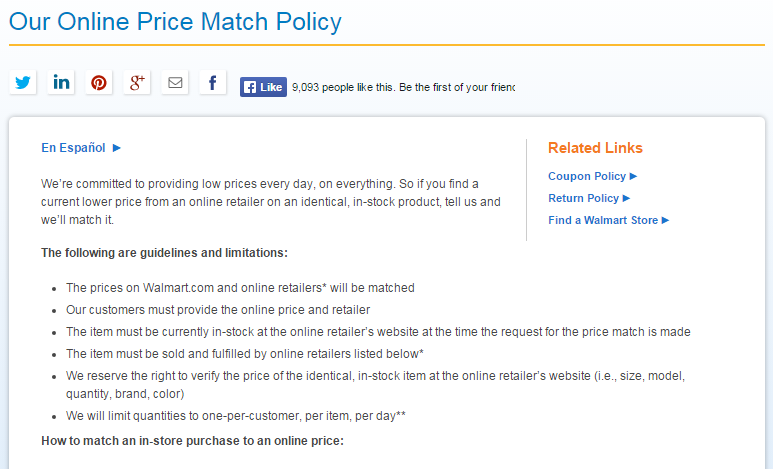
Brilliant!
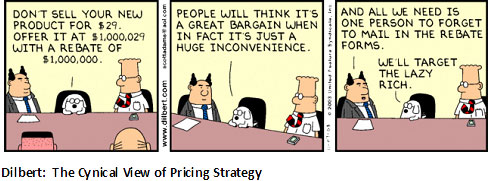
Tactical
Pricing mistakes can erode reputation
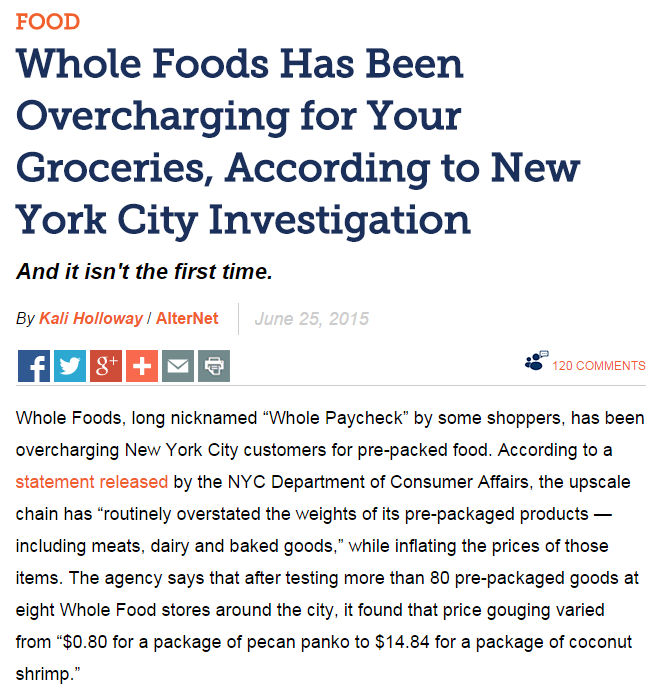
Errors become public almost instantly
Competitive (and own) prices transparent
The role of (OS) analytics in pricing
Analytical maturity varies at retailers
Sounds familiar?
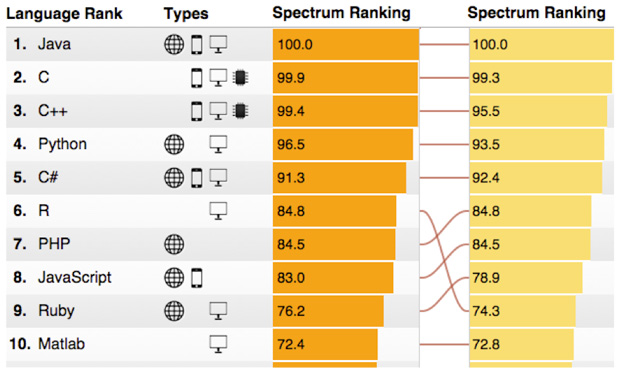
Why open source analytics?
Survey of O'Reilly Strata attendees in 2012-13

R and Python among top 10
Smart, reproducible price analytics are key
Data sources and how to monetize them
Retailer case study
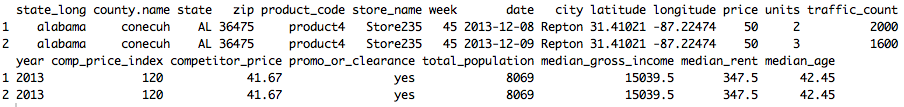
Our analytical data set
- Simulated data to mimic real aggregated POS data you would obtain internally
- Geo and demographic data obtained publicly
- Geo and demographic data obtained publicly
- Primary analytical tool is R, with some Python
- Data sets and full code for presentation is publicly available at https://github.com/KakasA09
- What can we do with our data to drive decisions (and ideally, $$$)?
Estimating price sensitivities by county and product
Price sensitivity vs. competitiveness

State level performance snapshot
- Visual analytics can easily be 5 dimensional
- …and reproducible
- …and value-added!
- …and reproducible
- Use scatterplot3d package in R to help you out
What shifts in strategy would you explore?

Which areas are driving (or eroding) price competitiveness?
- Let's take a look at our data again
- maps and ggplot packages enable you to visualize results and performance trends at the zip code and above levels
A national view

Retail locations in only two TN counties

What about in Nebraska?

The importance of textual data is growing
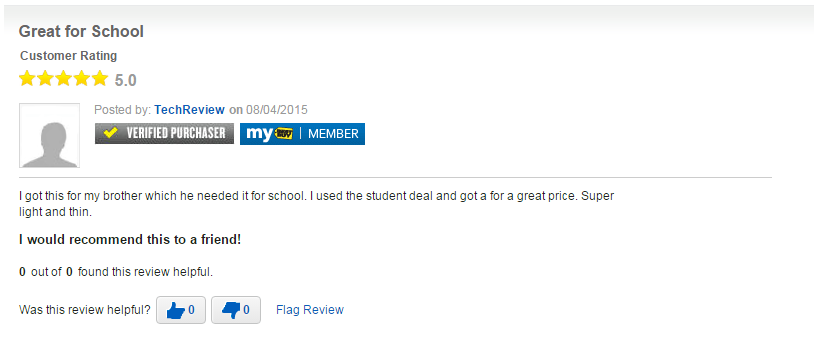
A recent example
Any relationship?

Distribution of daily sentiment scores

Sentiment polarity index vs. scores

One day after Amazon Prime Day (July 15)

Top taglines (4-6 ngrams) on July 16

Day of earnings results (July 23)

July 23 a stark contrast to July 16
