Clinical Graph - Risk Difference Plot with ggplot2
Duong Tran
23 January 2023”
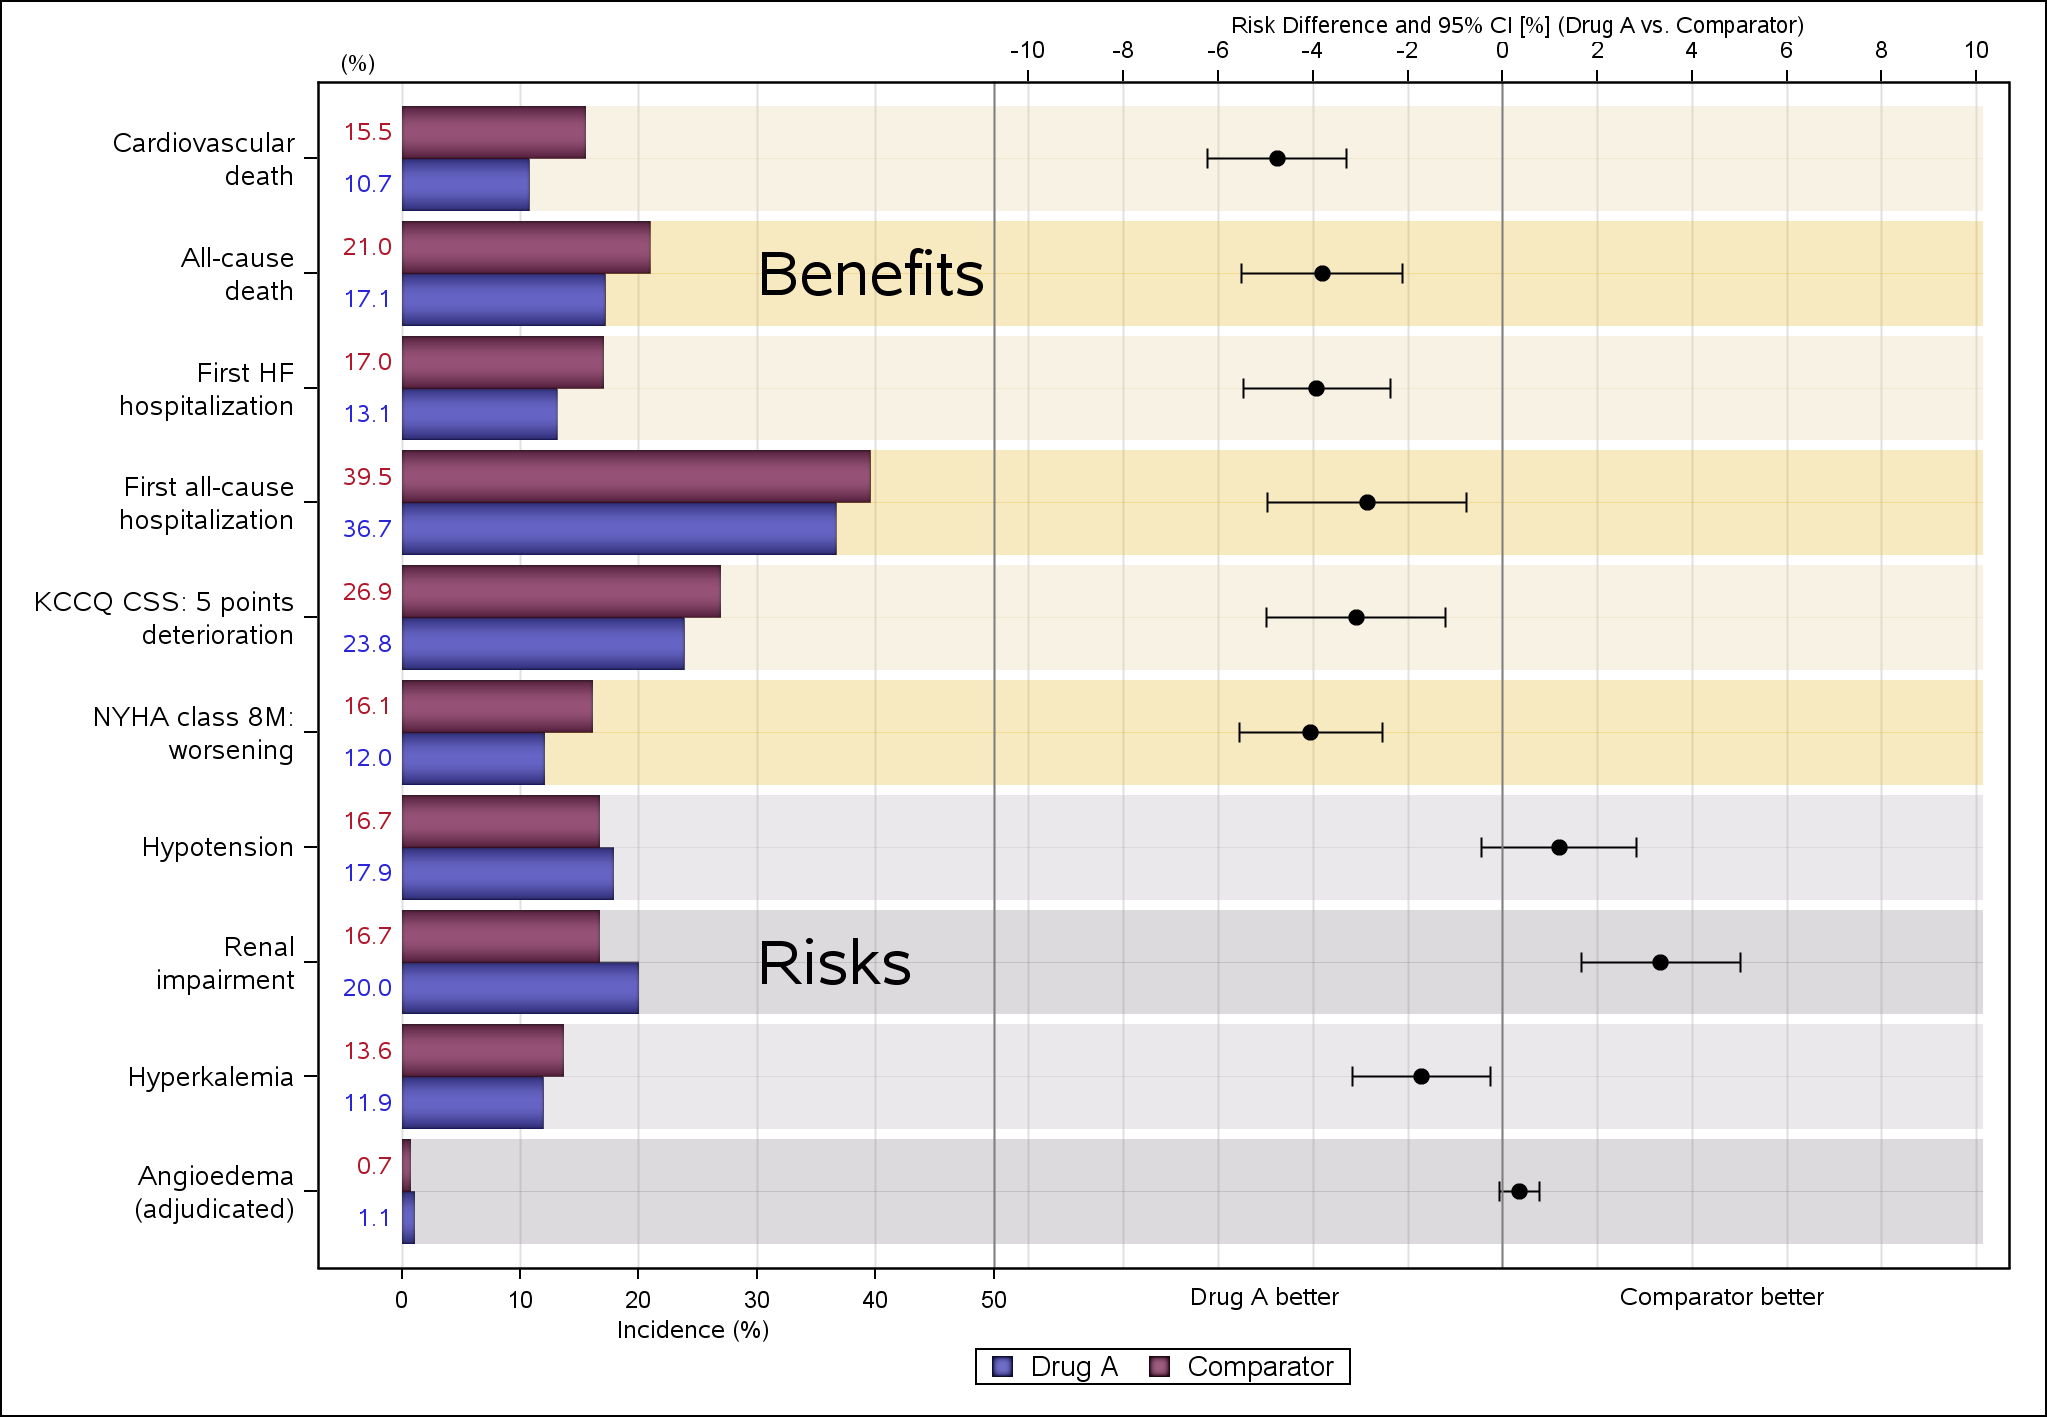
This is a Risk Difference plot sometime seen in Clinical Trial report. Here I replicate a similar SAS plot (see https://blogs.sas.com/content/graphicallyspeaking/files/2016/08/Risk_Diff_Plot.png) with ggplot2.
Plot 1

Plot 2
