
Ryan Clement, Data Services Librarian: go/ryan/

Wendy Shook, Science Data Librarian: go/wshook/

Jonathan Kemp, Telescope & Scientific Computing Specialist: go/jkemp/
June 29, 2021, 1:00-3:30 PM EDT
Ryan Clement, Data Services Librarian: go/ryan/
Wendy Shook, Science Data Librarian: go/wshook/
Jonathan Kemp, Telescope & Scientific Computing Specialist: go/jkemp/

tidyverse package?dplyrtidyrinstall.packages()library()help(package = "package_name")tidyverse package?
dplyr functions are verbsWe’re going to learn some of the most common dplyr functions:
select(): subset columnsfilter(): subset rows on conditionsmutate(): create new columns by using information from other columnsgroup_by() and summarize(): create summary statistics on grouped dataarrange(): sort resultscount(): count discrete valuesUsing pipes, subset the interviews data to include interviews where respondents were members of an irrigation association (memb_assoc) and retain only the columns affect_conflicts, liv_count, and no_meals.
When you’re done, please give a :thumbs-up: or a :green-check: in the Zoom reactions.
mutateFrequently you’ll want to create new columns based on the values in existing columns, for example to do unit conversions, or to find the ratio of values in two columns. For this we’ll use mutate().
Create a new dataframe from the interviews data that meets the following criteria: contains only the village column and a new column called total_meals containing a value that is equal to the total number of meals served in the household per day on average (no_membrs * no_meals). Only the rows where total_meals is greater than 20 should be shown in the final dataframe.
Hint: think about how the commands should be ordered to produce this data frame!
When you’re done, please give a :thumbs-up: or a :green-check: in the Zoom reactions.
dplyr makes this process easy, particularly with the group_by() and summarize() functions.
How many households in the survey have an average of two meals per day? Three meals per day? Are there any other numbers of meals represented?
When you’re done, please give a :thumbs-up: or a :green-check: in the Zoom reactions.
Use group_by() and summarize() to find the mean, min, and max number of household members for each village. Also add the number of observations (hint: see ?n).
When you’re done, please give a :thumbs-up: or a :green-check: in the Zoom reactions.
What was the largest household interviewed in each month?
Hint: this question requires the lubridate package, which you may (or may not) have worked with on your own after last week’s workshop.
When you’re done, please give a :thumbs-up: or a :green-check: in the Zoom reactions.
tidyrThere are essentially three rules that define a “tidy” dataset:
In this section we will explore how these rules are linked to the different data formats researchers are often interested in: “wide” and “long”.
First we will explore qualities of the interviews data and how they relate to these different types of data formats.
| id | x | y | z |
|---|---|---|---|
| 1 | 10 | 2.00 | 100 |
| 2 | 24 | 2.50 | 123 |
| 3 | 45 | 4.00 | 213 |
| 4 | 12 | 3.24 | 245 |
| 5 | 30 | 1.00 | 120 |
| id | name | value |
|---|---|---|
| 1 | x | 10.00 |
| 1 | y | 2.00 |
| 1 | z | 100.00 |
| 2 | x | 24.00 |
| 2 | y | 2.50 |
| 2 | z | 123.00 |
| 3 | x | 45.00 |
| 3 | y | 4.00 |
| 3 | z | 213.00 |
| 4 | x | 12.00 |
| 4 | y | 3.24 |
| 4 | z | 245.00 |
| 5 | x | 30.00 |
| 5 | y | 1.00 |
| 5 | z | 120.00 |
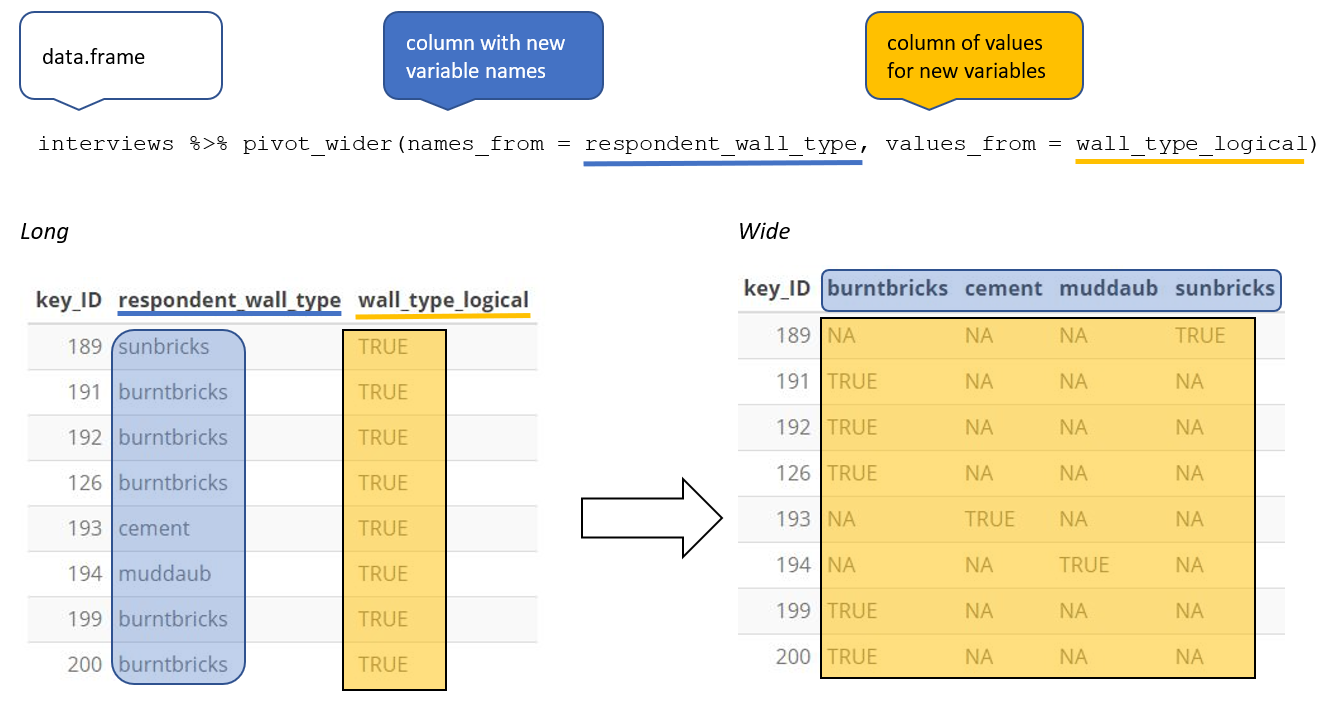
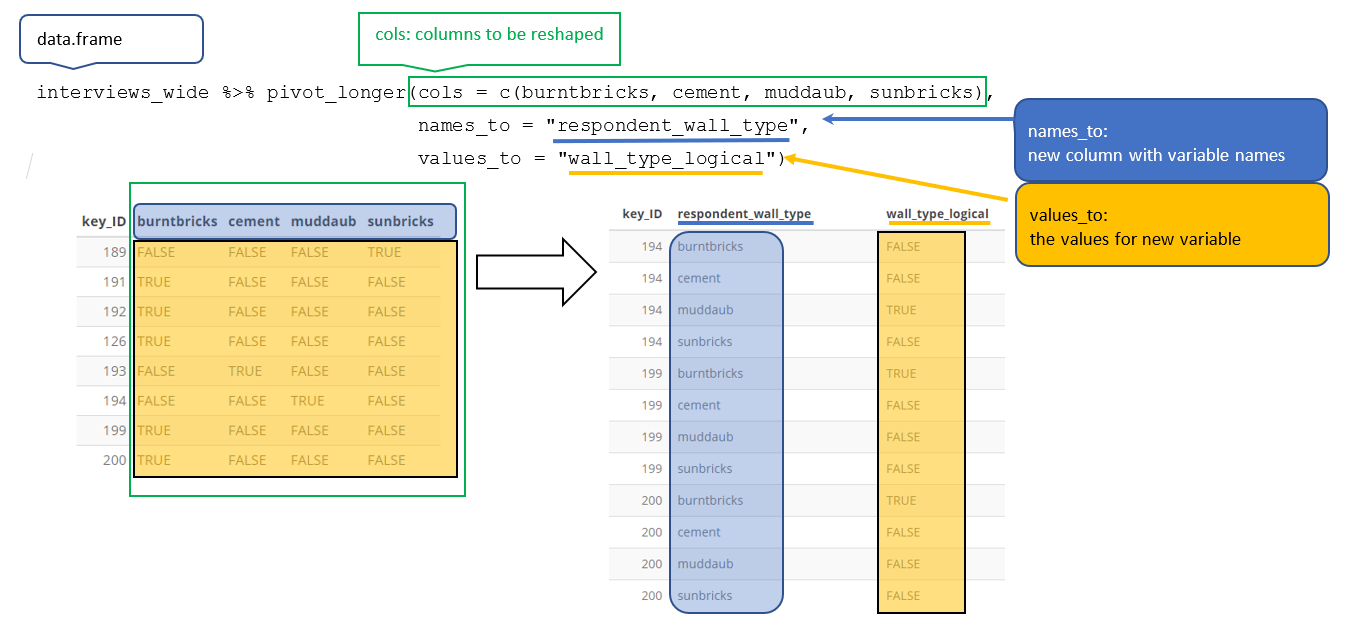
pivot_wider()Create a new dataframe (named interviews_months_lack_food) that has one column for each month and records TRUE or FALSE for whether each interview respondent was lacking food in that month.
When you’re done, please give a :thumbs-up: or a :green-check: in the Zoom reactions.
How many months (on average) were respondents without food if they did belong to an irrigation association? What about if they didn’t?
When you’re done, please give a :thumbs-up: or a :green-check: in the Zoom reactions.
Similar to the read_csv() function used for reading CSV files into R, there is a write_csv() function that generates CSV files from dataframes.
Before using write_csv(), we are going to create a new folder, data_output, in our working directory that will store this generated dataset. We don’t want to write generated datasets in the same directory as our raw data. It’s good practice to keep them separate. The data folder should only contain the raw, unaltered data, and should be left alone to make sure we don’t delete or modify it. In contrast, our script will generate the contents of the data_output directory, so even if the files it contains are deleted, we can always re-generate them.
To sign up for more sessions: go/summer-data-workshops/
Assessment survey: go/summer-data-assessment/
Ryan’s contact info: go/ryan/