Albert Y. Kim
Monday 2015/04/27
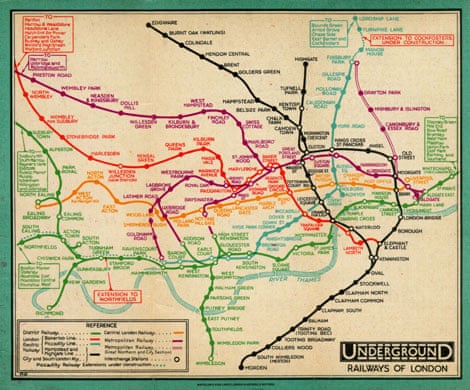
Behold, the London Underground map, in all of its glory!
Think in terms of aesthetics, as defined by The Grammar of Graphics
The (x,y) positions on the map are distortions of the actual locations. Check out the geographically faithful map.
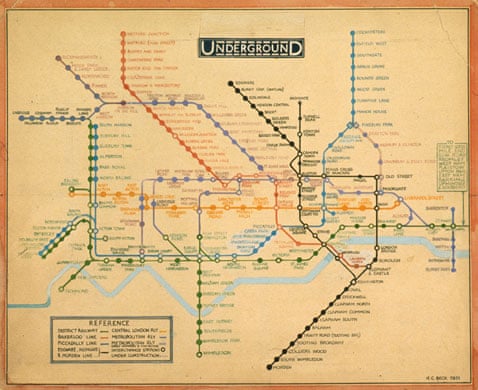
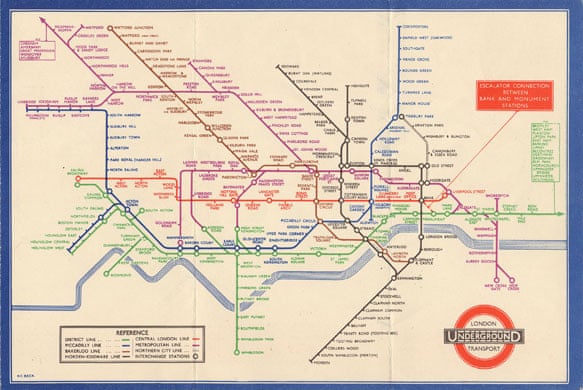
The Beck map:
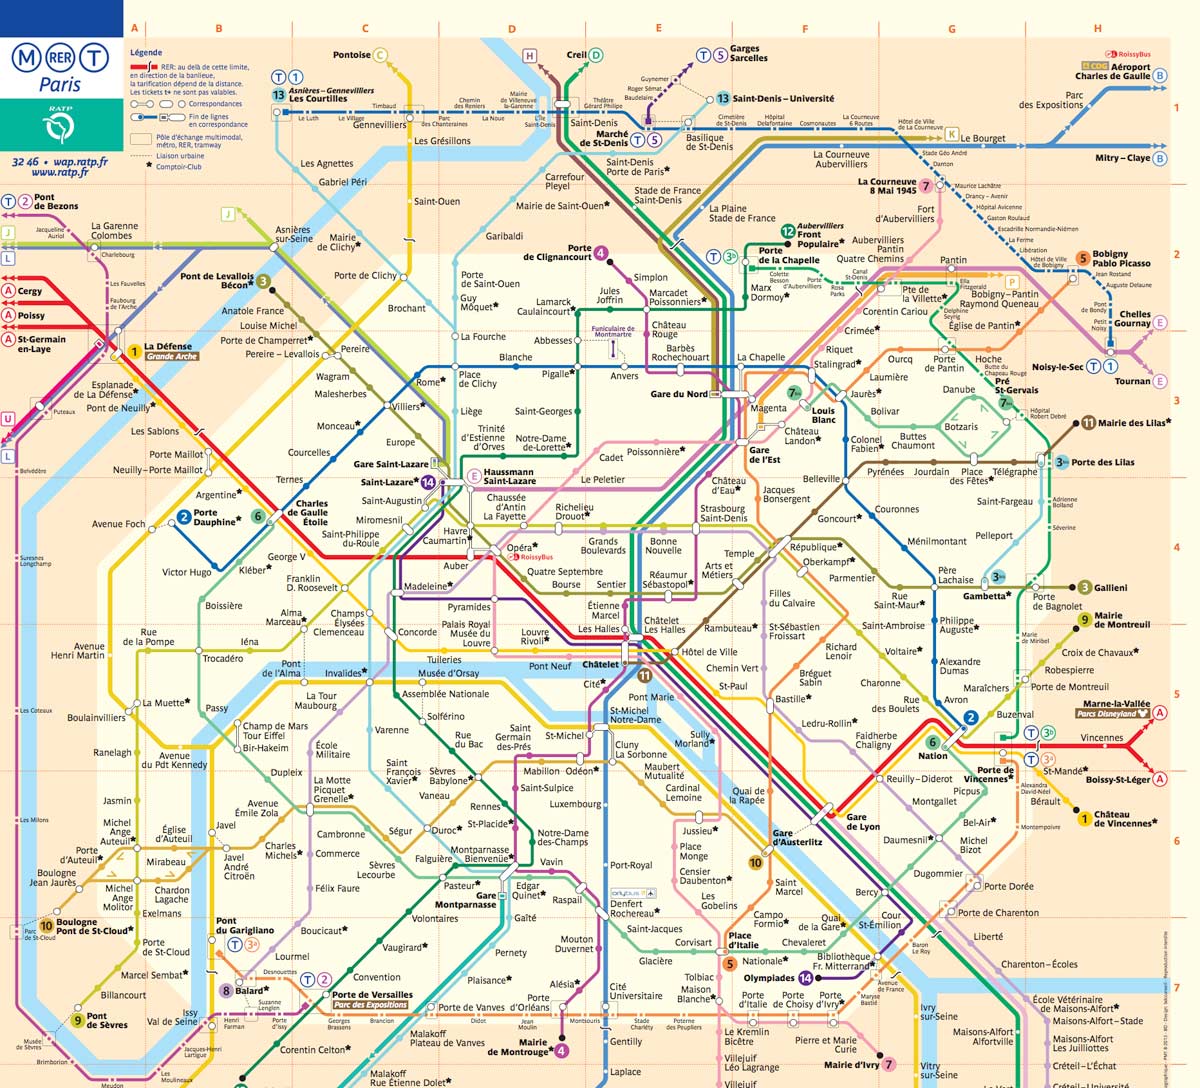
Almost every subway map in the world follows this format.
Brain Candy: Cameron Booth's Interstate subway map
Open dataset.csv on Moodle or GitHub, load in R, and for each of the 4 levels of group:
This dataset is known as Anscombe's Quartet which has near identical summary statistics (means, standard deviations, correlation coefficients, and regression coefficient).
They were developped to demonstrate both the importance of graphing data before analyzing it and the effect of outliers on statistical properties.
Go to my Twitter account and check-out my retweet of @rhobott of a PLOS Biology paper.
Adriana Escobedo-Land's thesis: