Influenza and Pneumonia Mortality during the Global COVID-19 Pandemic and the Impact of Local Government Restrictions
Angel Claudio, Bonnie Cooper, Manolis Manoli, Magnus Skonberg, Christian Thieme, Leo Yi
"2021-05-23"
Communicable Disease during COVID-19
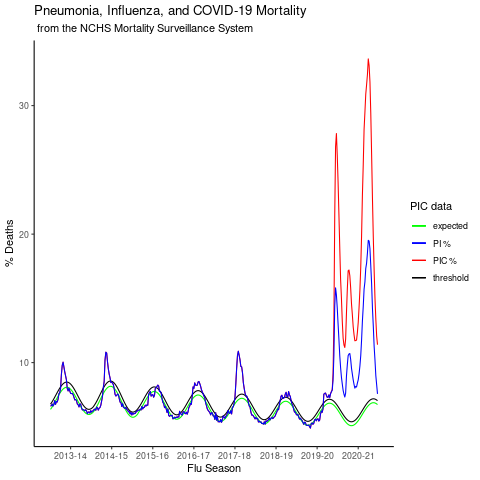
Pneumonia, Influenza and COVID-19 mortality in the U.S.
State-level excess Pneumonia and Influenza mortality
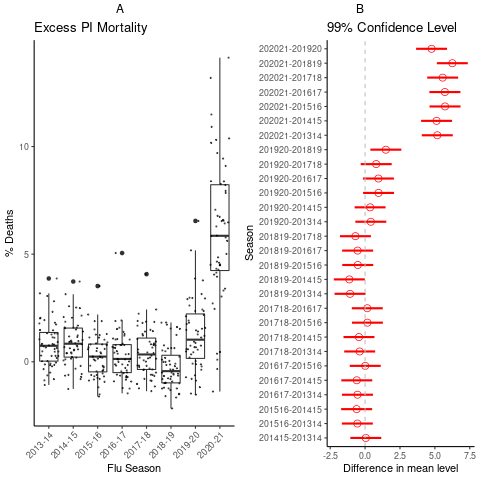
Figure A) state-level excess PI
Figure B) Tukey Honest Significant Differences of Means test
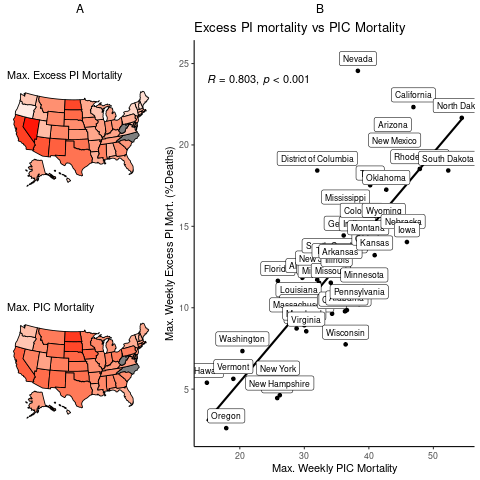
State-level relationship of excess PI mortality and PIC mortality
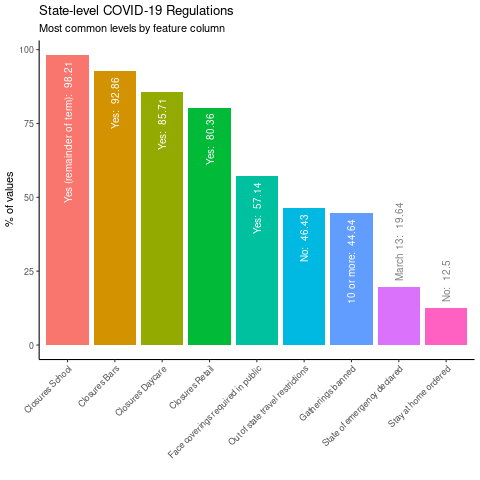
State-level Government COVID-19 Restriction Data
Modeling Excess PI Mortality with Government Restriction Data
Model Comparison Table
Model Selection
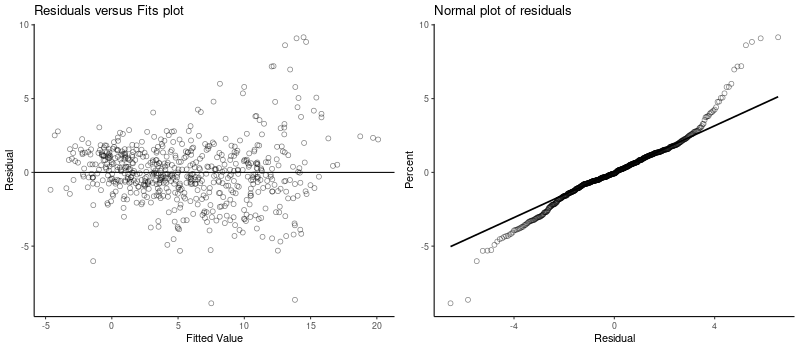
Model Evaluation
Although our model improves upon the description of excess PI mortality, there is room for improvement: diagnostic plots reveal that residual variance is not constant across the model fit (left panel) and the normality plot of residuals suggests high-skewed distribution