Project Part: 1 - Updated Football Stadium Statistics
Pujan
04/04/2021
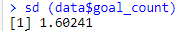
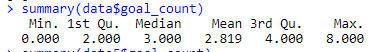
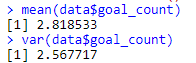
Mean, standard deviation, summary
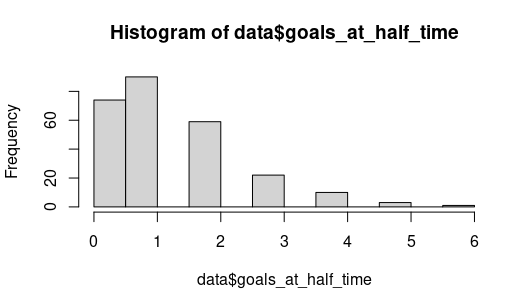
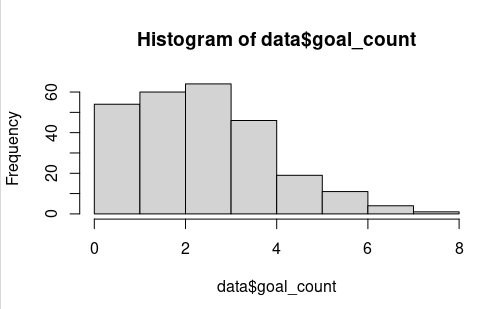
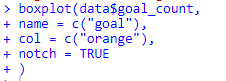
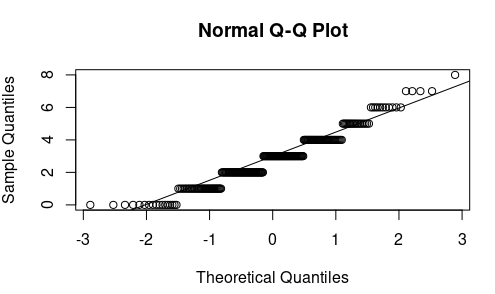
2. a) graphical displays (histogram, box plot and qq plot)
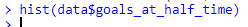
2.
Are there any outliers? No
Is the distribution normal, symmetric, skewed, or some other shape? No
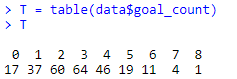
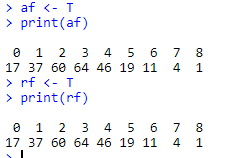
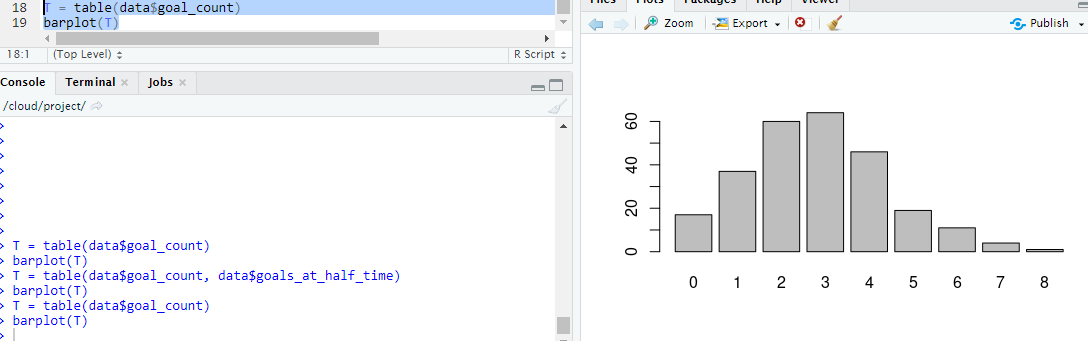
b) Categorical variables, include a frequency and relative frequency table.
2.
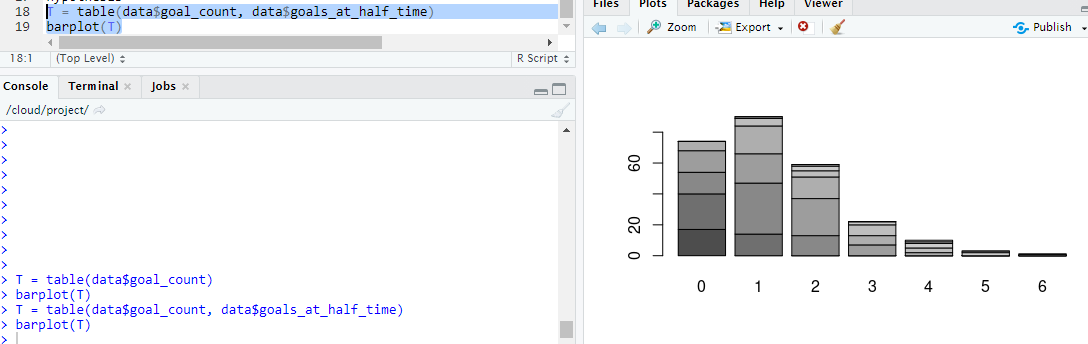
c) Include a two-way table for two of the categorical variables and discuss any relevant proportions. Describe any possible relationship between the two variables.
Answer:
• There is an association between absolute frequency table and relative frequency table. These are called bivariate associations.
• Summarize the linear relationship.
• We can calculate the correlation.
• It is used more widely, more sensitive to errors and discrepancies in data.
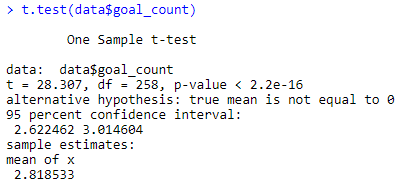
3. Preform hypothesis test
(a) Using the appropriate statistical test, preform a hypothesis test comparing a mean to a fixed value. Make certain to properly state your null and alternative hypothesis. State your conclusion in the correct statistical language.
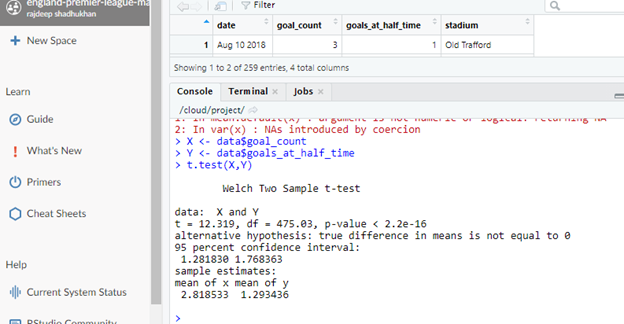
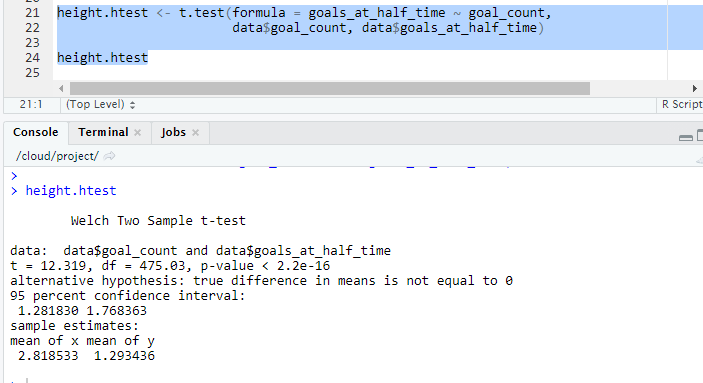
(b) Using the appropriate statistical test, preform a hypothesis test comparing two means. Make certain to properly state your null and alternative hypothesis. State your conclusion in the correct statistical language.
Null hypothesis is H0, it has no effect and no difference.
Conclusion:
Hypotheses for this test. We reject H0 and accept H1 since the P-value is smaller significance amount 1.293436.
Preform regression
slope of the regression
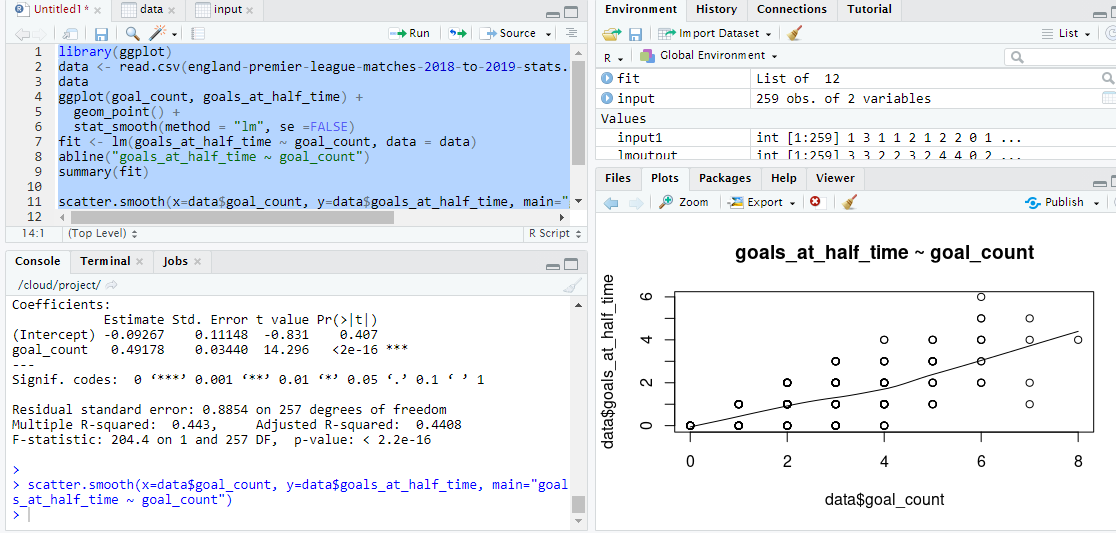
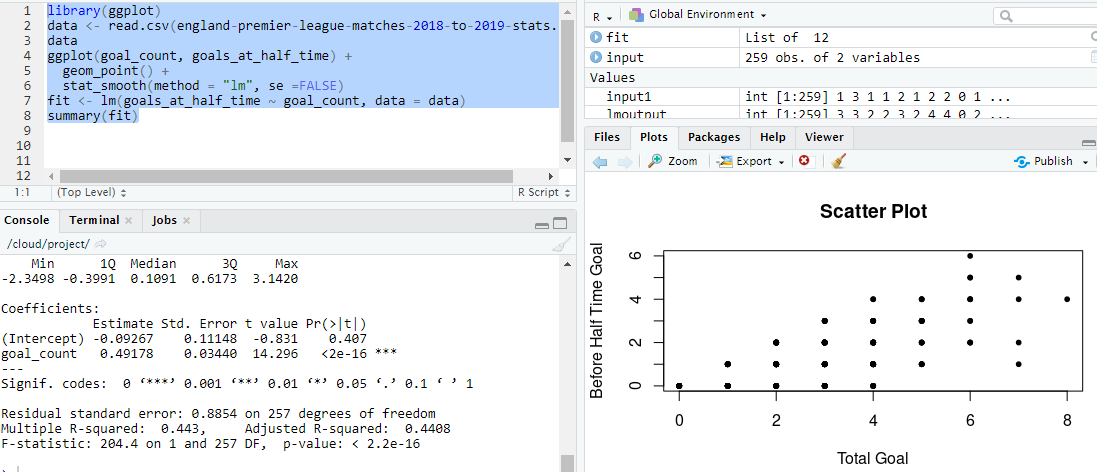
The scatter diagram plots two sets of numerical data, one on each axis, to see if there's a correlation between them. The points will fall into a line or curve if the variables are associated.
When one of two variables are related to the other in some way, there is a connection between them. The best way to start is with a scatterplot. A scatterplot (or scatter diagram) is a graph with a horizontal x-axis and a vertical y-axis that depicts paired (x, y) sample results. Each (x, y) pair is plotted separately as a single point.
Hypothesis test on the correlation
Use categorical variable to repeat the regression on a subset of data
Multiple regression using an indicator for the categorical variable
4
(a) Introduce your data set including a reference to where it can be found. Describe all relevant variables that you will use in your analysis.
Answer:
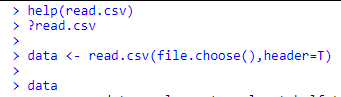
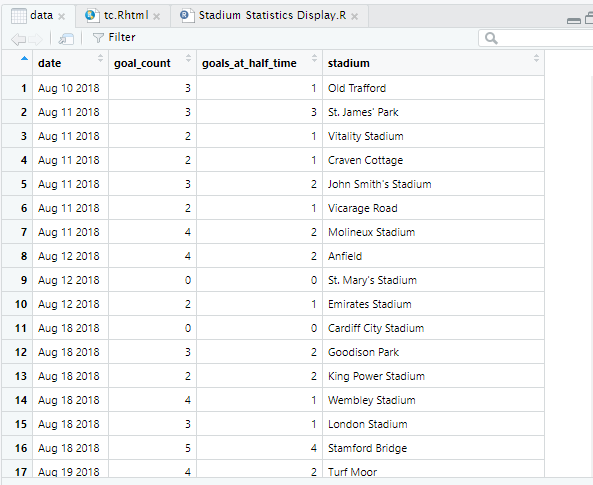
I have downloaded the england-premier-league-matches-2018-to-2019-stats.csv file using the link “https://footystats.org/download-stats-csv” and sorted data by four rows (date, goal_count, goals_at_half_time and stadium.
In this file date column is the indicator of date of the match, goal_count column is the pointer of goal, goals_at_half_time column is the index to reveal the goal before the half time of the match and lastly stadium column is the displayer of the place where the match played.
(b) Include all items requested above. Include graphs and text about each.
Answer: All statistics data, graph and relationship I have explained above in details.
(c) Write a brief conclusion highlighting the most interesting features of your data.
Answer:
This file contains the stadium and the number of goals stats. It contains more in-depth data. From the statistical analysis I can conclude the history of the stadium and the highest goal in which stadium. Most interesting part is from the data stats I can choose top 5 stadium for future league purpose and the importance of the stadium.