Poisson Distribution
Savanna Torres
10/22/2020
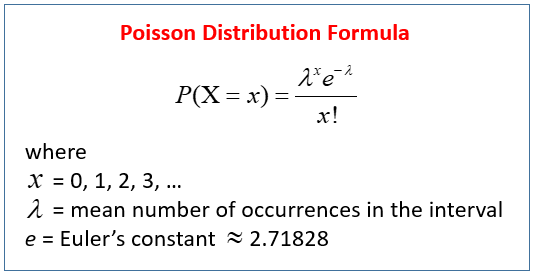
The Poisson distribution is a discrete probability distribution that conveys the probability of n events occuring in a fixed period of time if the events take place with a known constant mean rate and independently of each occurrence.
Probability Distribution Function

Chart
In light of the World Series, for my example I will be using Dodgers’ Mookie Betts’ batting average to get the probability that he will reach 20 or more hits in the postseason. His current batting average is .327. In the last 14 games he has been at bat 52 times. If the World Series goes to game 7 and he avearages the same amount of opportunities to bat, we can estimate he will have another 19 appearances at the plate.
#Probability of x = 20
dpois(x = 20, lambda = .327 * 71)
## [1] 0.07030439#Probability of x > 20
ppois(q = 20, lambda = .327 * 71, lower.tail = FALSE)## [1] 0.7053827#Probability of X < 20
ppois(q = 20, lambda = .327 * 71, lower.tail = TRUE)## [1] 0.2946173We find that there is a 70.5% probability of Mookie Betts getting more than 20 hits during his postseason career.
Graph
library(ggplot2)
library(dplyr)
##
## Attaching package: 'dplyr'## The following objects are masked from 'package:stats':
##
## filter, lag## The following objects are masked from 'package:base':
##
## intersect, setdiff, setequal, unionoptions(scipen = 999, digits = 1)
hits <- 0:40
density <- dpois(x = hits, lambda = .327 * 71)
prob <- ppois(q = hits, lambda = .327 * 71, lower.tail = TRUE)
df <- data.frame(hits, density, prob)
ggplot(df, aes(x = hits, y = density)) +
geom_col() +
labs(title = "Will Betts get more than 20 postseason hits?",
subtitle = "PMF and CDF of Poisson distribution.",
x = "Hits",
y = "Density") +
geom_line(data = df, aes(x = hits, y = prob))