- Purpose and explanation of App
- Basic instructions for running the app
- Revealing the answer plus background information
- What it looks like in action
Purpose and explanation of App
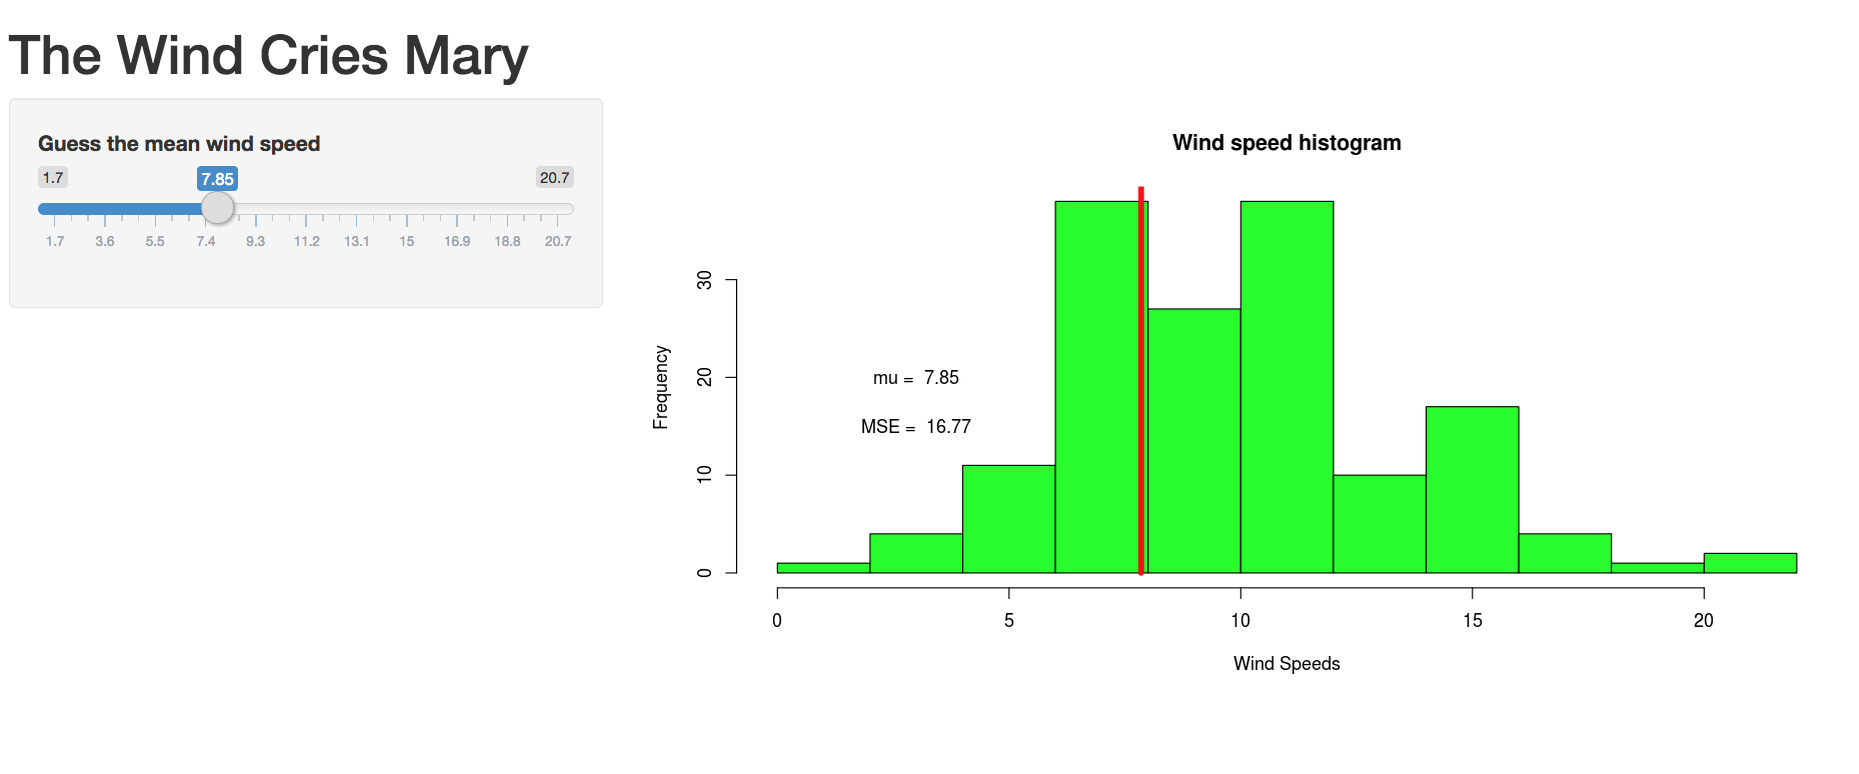
The App takes wind data from the 'airquality' data set in RStudio, and allows you to guess mean value for the that wind data
The App has a histogram of the wind data, as well as values for the estimated mean (called mu in the App) and current mean squared error (called MSE in the App)
By manipulating the slider and looking at the mean square error value, you can estimate the mean by stopping at what you think is the minimum mean square error value