In a recent mythical poll in Scotland, voters were asked if they preferred Cullen skink over Partan bree. Here are the results of the poll, with results broken down by city and by age group.
March 7, 2015
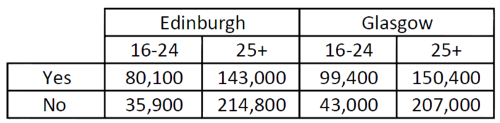
In a recent mythical poll in Scotland, voters were asked if they preferred Cullen skink over Partan bree. Here are the results of the poll, with results broken down by city and by age group.
data.messy <- data.frame(response=as.factor(c("Yes","No"))
                         ,edinburgh.16_24=c(80100,35900)
                         ,edinburgh.25_plus=c(143000,214800)
                         ,glasgow.16_24=c(99400,43000)
                         ,glasgow.25_plus=c(150400,207400)
                         )
(data.messy)
##   response edinburgh.16_24 edinburgh.25_plus glasgow.16_24 glasgow.25_plus
## 1      Yes           80100            143000         99400          150400
## 2       No           35900            214800         43000          207400
data.tidy <- data.messy %>%
  gather(variable, value, -response) %>%
  separate(variable,into=c("city","age.group"),extra="merge")%>%
  rename(preference=response)%>%
  arrange(city,age.group,preference)

levels(data.tidy$preference) <- list("Cullen skink"="Yes"
                                     ,"Partan bree"="No")
head(data.tidy)
##     preference      city age.group  value
## 1  Partan bree edinburgh     16_24  35900
## 2 Cullen skink edinburgh     16_24  80100
## 3  Partan bree edinburgh   25_plus 214800
## 4 Cullen skink edinburgh   25_plus 143000
## 5  Partan bree   glasgow     16_24  43000
## 6 Cullen skink   glasgow     16_24  99400
data.tidy %>%
  group_by(city) %>%
  summarise(
    total_participants = sum(value)
    )
## Source: local data frame [2 x 2]
##
##        city total_participants
## 1 edinburgh             473800
## 2   glasgow             500200
data.tidy %>%
  filter(preference=="Cullen skink") %>%
  group_by(city) %>%
  summarise(
    prefer_cullen_skink_total = sum(value)
    )
## Source: local data frame [2 x 2]
##
##        city prefer_cullen_skink_total
## 1 edinburgh                    223100
## 2   glasgow                    249800
Glasgow is of Cullen Skink capital!!
data.tidy %>%
  filter(preference=="Partan bree") %>%
  group_by(city) %>%
  summarise(
    prefer_partan_bree_total = sum(value)
    )
## Source: local data frame [2 x 2]
##
##        city prefer_partan_bree_total
## 1 edinburgh                   250700
## 2   glasgow                   250400
It seems that Partan bree rules in both Glasgow and and Edinburgh


For Partan Bree:
For Cullen Skink: