- Recap on progress with the coursework
- Practical working on your projects
- (And an opportunity to ask questions)
SSPA course2020-03-23. Code: https://github.com/ITSLeeds/SSPA
Session outline:
Recap on previous sessions
- Many examples of indicators presented (none right or wrong)
- Why bother creating indicators?
- What different types of indicators are there?
- How can geographic data analysis help?
Key resources:
- Slides + video by Ian on assessment
- The QGIS booklet with simple example indicator: https://itsleeds.github.io/QGIS-intro/
Why make indicators?
Source: (Boisjoly and El-Geneidy 2017)

Indicators change the world
- Most indicators emphasise time saving and economic growth, leading to the misled emphasis on motorised modes and speed (Banister 2008)
- Different indicators can lead to different policies.
- The Propensity to Cycle Tool (PCT) is changing how millions of £ is being invested in cycling, making it more evidence-based (Lovelace et al. 2017)
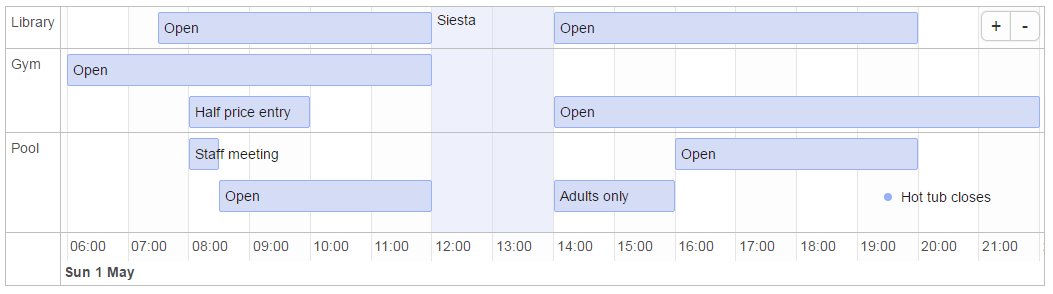
Indicators can be simple
If communicated effectively
See www.pct.bike

Tip: be skeptical of existing measures

- How good is this indicator? (source: Mattingly and Morrissey 2014)
An interactive catch-up on progress (virtual hands up)
- Who plans to use QGIS?
- Study area decisions
- Indicator aims decided
- Data access
- Data analysis started
Progress with coursework
- Gantt charts are useful!

Examples of good project reports
See examples in teaching resources

Warning on using large datasets
- But first 5 commandments of Big Data (see Lovelace et al. 2016):
- thou shalt remember the purpose of thine research regardless of the size of thine dataset
- thou shalt not spend excessive amounts of time making visualising big data for the sake of it (or social media clickbait)
- thou shalt not do big data until thou has done ‘small data’ first
- thou shalt not hide thine ideas behind complex terminology associated with the terms ‘big data’ or ‘data science’, the meaning of which has not been clearly identified.
- if thou wants to be a data scientist thou must program … “for documentation, sharing and scientific repeatability” (mount 2016).
References
Banister, David. 2008. “The Sustainable Mobility Paradigm.” Transport Policy 15 (2): 73–80. https://doi.org/DOI: 10.1016/j.tranpol.2007.10.005.
Boisjoly, Genevi‘eve, and Ahmed M. El-Geneidy. 2017. “The Insider: A Planners’ Perspective on Accessibility.” Journal of Transport Geography 64 (October): 33–43. https://doi.org/10.1016/j.jtrangeo.2017.08.006.
Lovelace, Robin, Mark Birkin, Philip Cross, and Martin Clarke. 2016. “From Big Noise to Big Data: Toward the Verification of Large Data Sets for Understanding Regional Retail Flows.” Geographical Analysis 48 (1): 59–81. https://doi.org/10.1111/gean.12081.
Lovelace, Robin, Anna Goodman, Rachel Aldred, Nikolai Berkoff, Ali Abbas, and James Woodcock. 2017. “The Propensity to Cycle Tool: An Open Source Online System for Sustainable Transport Planning.” Journal of Transport and Land Use 10 (1). https://doi.org/10.5198/jtlu.2016.862.
Mattingly, K., and J. Morrissey. 2014. “Housing and Transport Expenditure: Socio-Spatial Indicators of Affordability in Auckland.” Cities 38 (June): 69–83. https://doi.org/10.1016/j.cities.2014.01.004.