2019-04-30
Outline
Contents
- Recap + context
- The PCT
- The CyIPT
- Live demo
- Next steps
Recap + context
The scale of the challenge, from this…
](https://pbs.twimg.com/media/DOH94nXUIAAgcll.jpg)
Source: Brent Toderian
Towards cycling being the natural choice
](https://pbs.twimg.com/media/DJaWCo0U8AAzQGW.jpg:large)
Source: Brent Toderian
Spheres of influence

Problem: lack of data

Problem: evidence overload

Consequences of ‘evidence overload’
- Problem is operationalising this data (Lovelace et al. 2017)
- Needs to be provided in a format that can be acted on at the local level. Not like http://citydashboard.org/london/
- Requires a diverse team
Indices to deal with evidence overload
- Create an (accessibility) indicator
- Which combines multiple data sources
- Into a single, digestible output
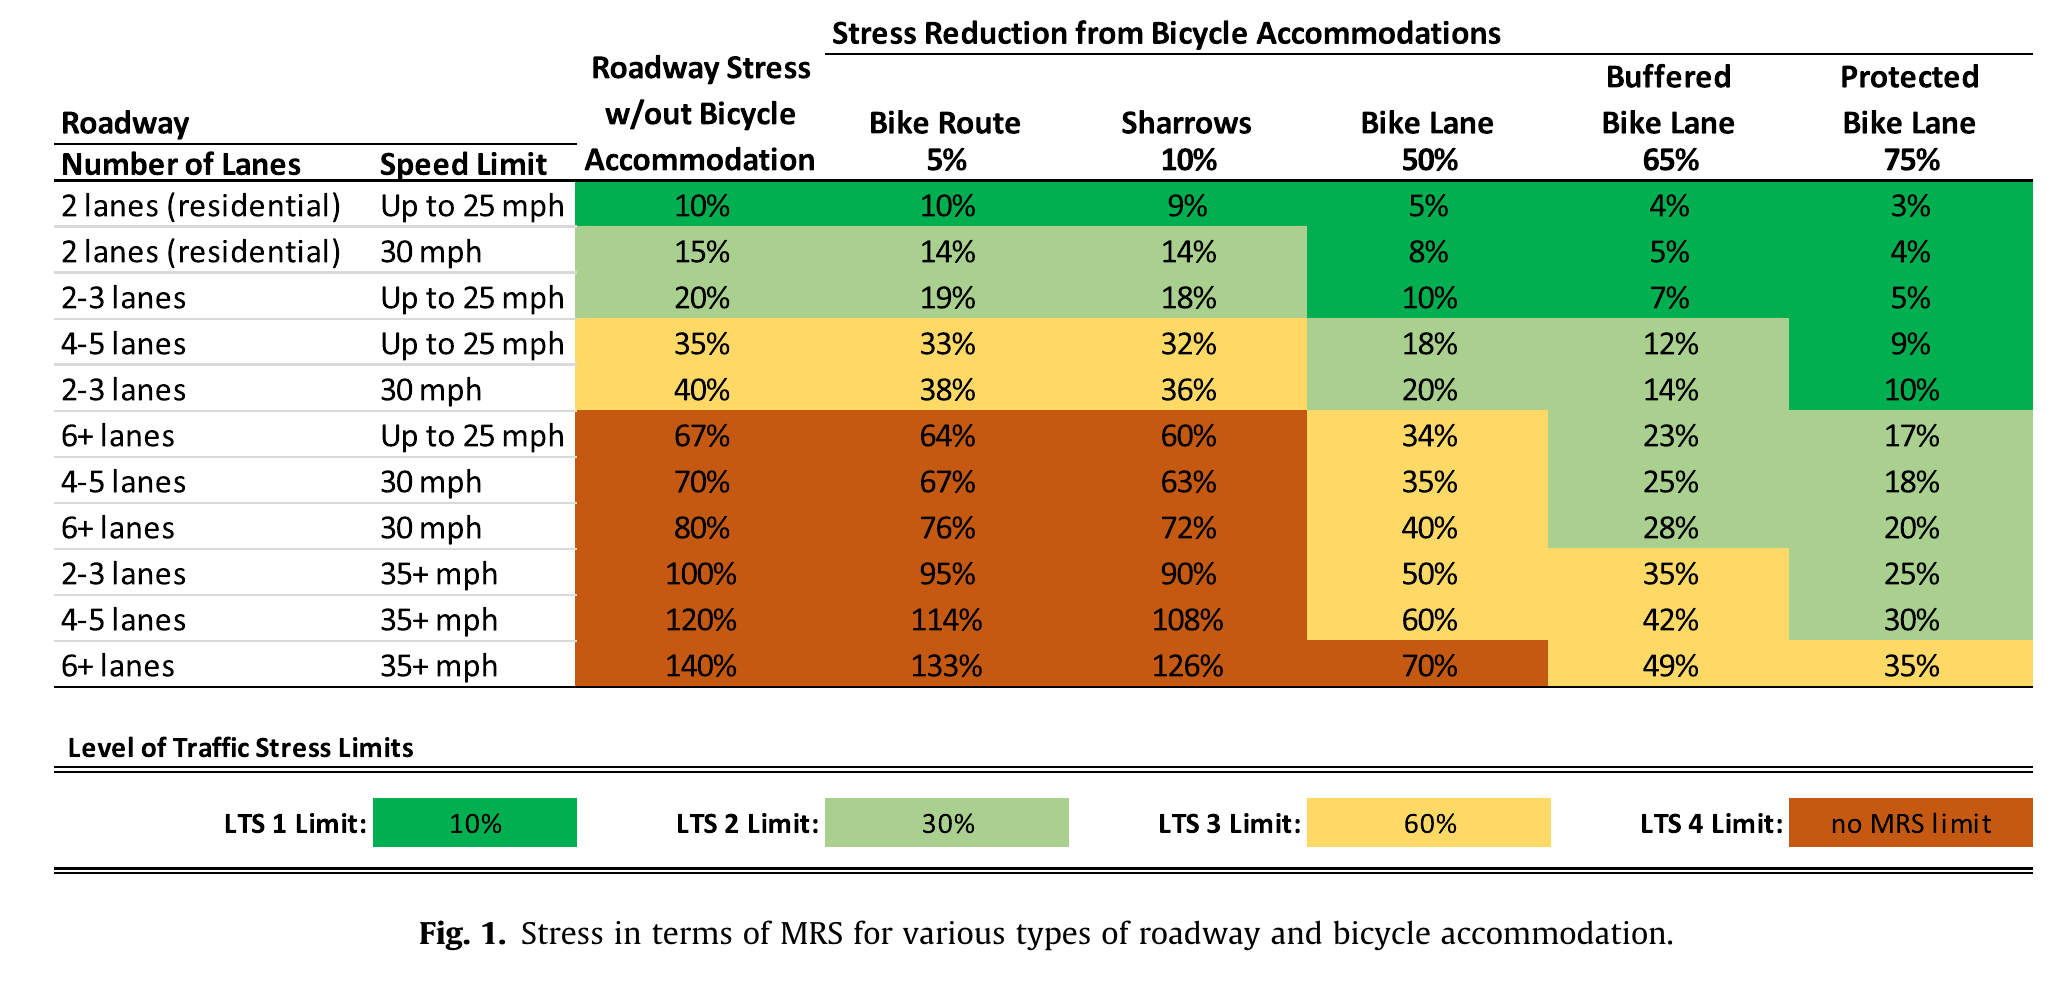
Example: Level of Transport Stress (LTS) (Lowry, Furth, and Hadden-Loh 2016)
The PCT
Background
Collaborative working
- Robin Lovelace (Lead Developer, University of Leeds)
- James Woodcock (Principal Investigator, Cambridge University)
- Anna Goodman (Lead Data Analyst, LSHTM)
- Rachel Aldred (Implementation Lead, Westminster University)
- Ali Abbas (User Interface, University of Cambridge)
- Alvaro Ullrich (Data Management, University of Cambridge)
- Nikolai Berkoff (System Architecture, Independent Developer)
- Malcolm Morgan (GIS and infrastructure expert, UoL)
Historical (personal) context
- These tools have been 3+ years in the making
- Origins go back further
Concept (PhD) -> Job at UoL (2009 - 2013)
 Discovery of R programming and shiny (2013)
  Link-up with Cambridge University and colleagues (2015)
    Implementation on national OD dataset, 700k routes (2016)
      Completed LSOA phase (4 million lines!) (2017)
        PCT Wales commissioned + CyIPT Phase III (2018)
- Internationalisation (2019?)
Academic context (source: Lovelace et al. 2017)
| Tool | Scale | Coverage | Public access | Format of output | Levels of analysis | Software licence |
|---|---|---|---|---|---|---|
| Propensity to Cycle Tool | National | England | Yes | Online map | A, OD, R, RN | Open source |
| Prioritization Index | City | Montreal | No | GIS-based | P, A, R | Proprietary |
| PAT | Local | Parts of Dublin | No | GIS-based | A, OD, R | Proprietary |
| Usage intensity index | City | Belo Horizonte | No | GIS-based | A, OD, R, I | Proprietary |
| Cycling Potential Tool | City | London | No | Static | A, I | Unknown |
| Santa Monica model | City | Santa Monica | No | Static | P, OD, A | Unknown |
National policy context - see www.pct.bike
Cycling and Walking Infrastructure Strategy (CWIS): to ‘double cycling’

The international dimension
](https://raw.githubusercontent.com/ATFutures/who/master/fig/sevnet2.png)
~200 km cycle network in Seville, Spain. Source: WHO report at ATFutures/who
- Not a UK-specific issue, but benefits of country-specific tools
What can the PCT do? - see www.pct.bike
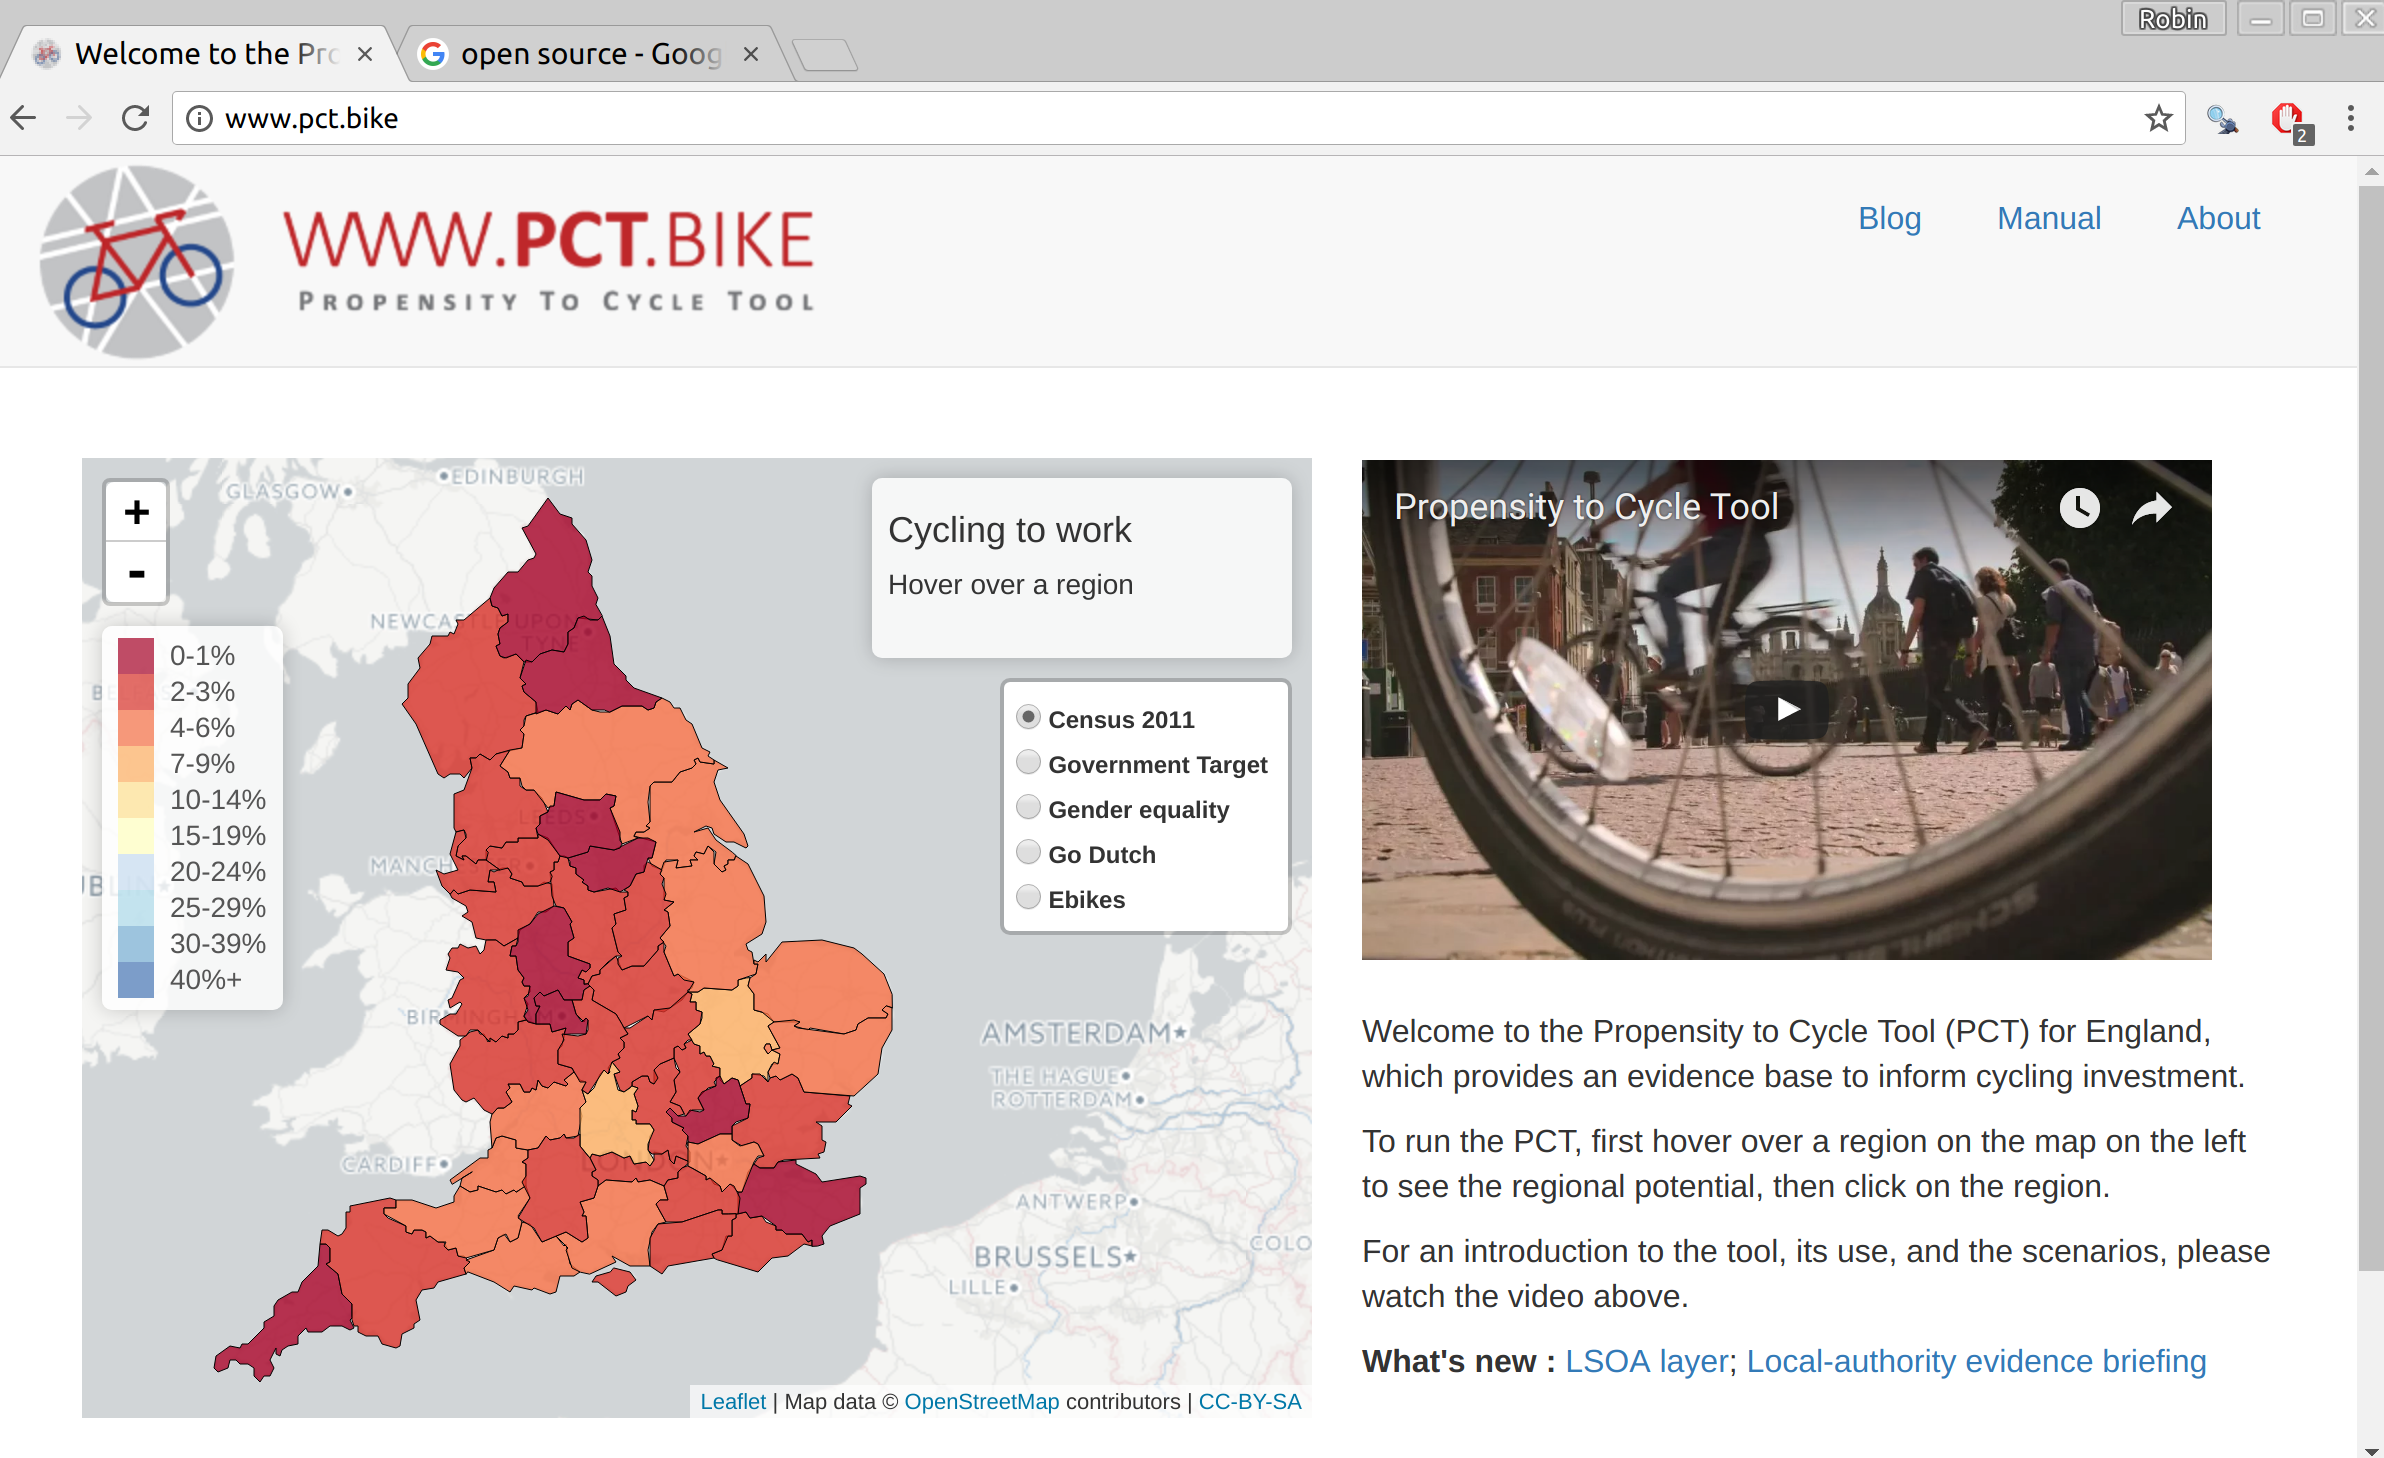
The front page of the open source, open access Propensity to Cycle Tool (PCT).
Policy feedback
“The PCT is a brilliant example of using Big Data to better plan infrastructure investment. It will allow us to have more confidence that new schemes are built in places and along travel corridors where there is high latent demand.”
- Shane Snow: Head of Seamless Travel Team, Sustainable and Acessible Travel Division
“The PCT shows the country’s great potential to get on their bikes, highlights the areas of highest possible growth and will be a useful innovation for local authorities to get the greatest bang for their buck from cycling investments and realise cycling potential.”
- Andrew Jones, Parliamentary Under Secretary of State for Transport
The Cycling Infrastructure Prioritisation Toolkit (CyIPT)
Tookit design
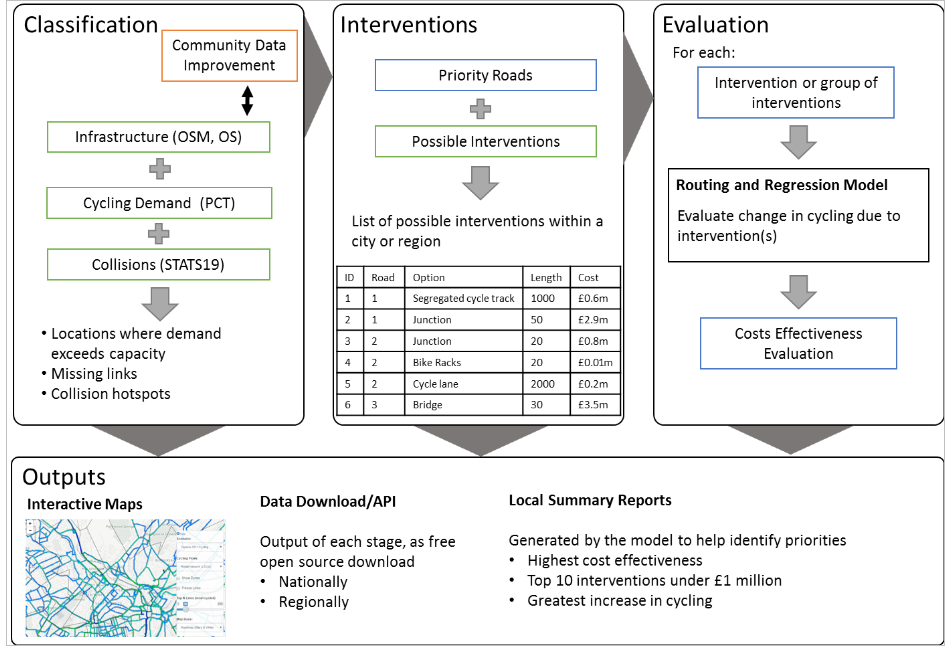
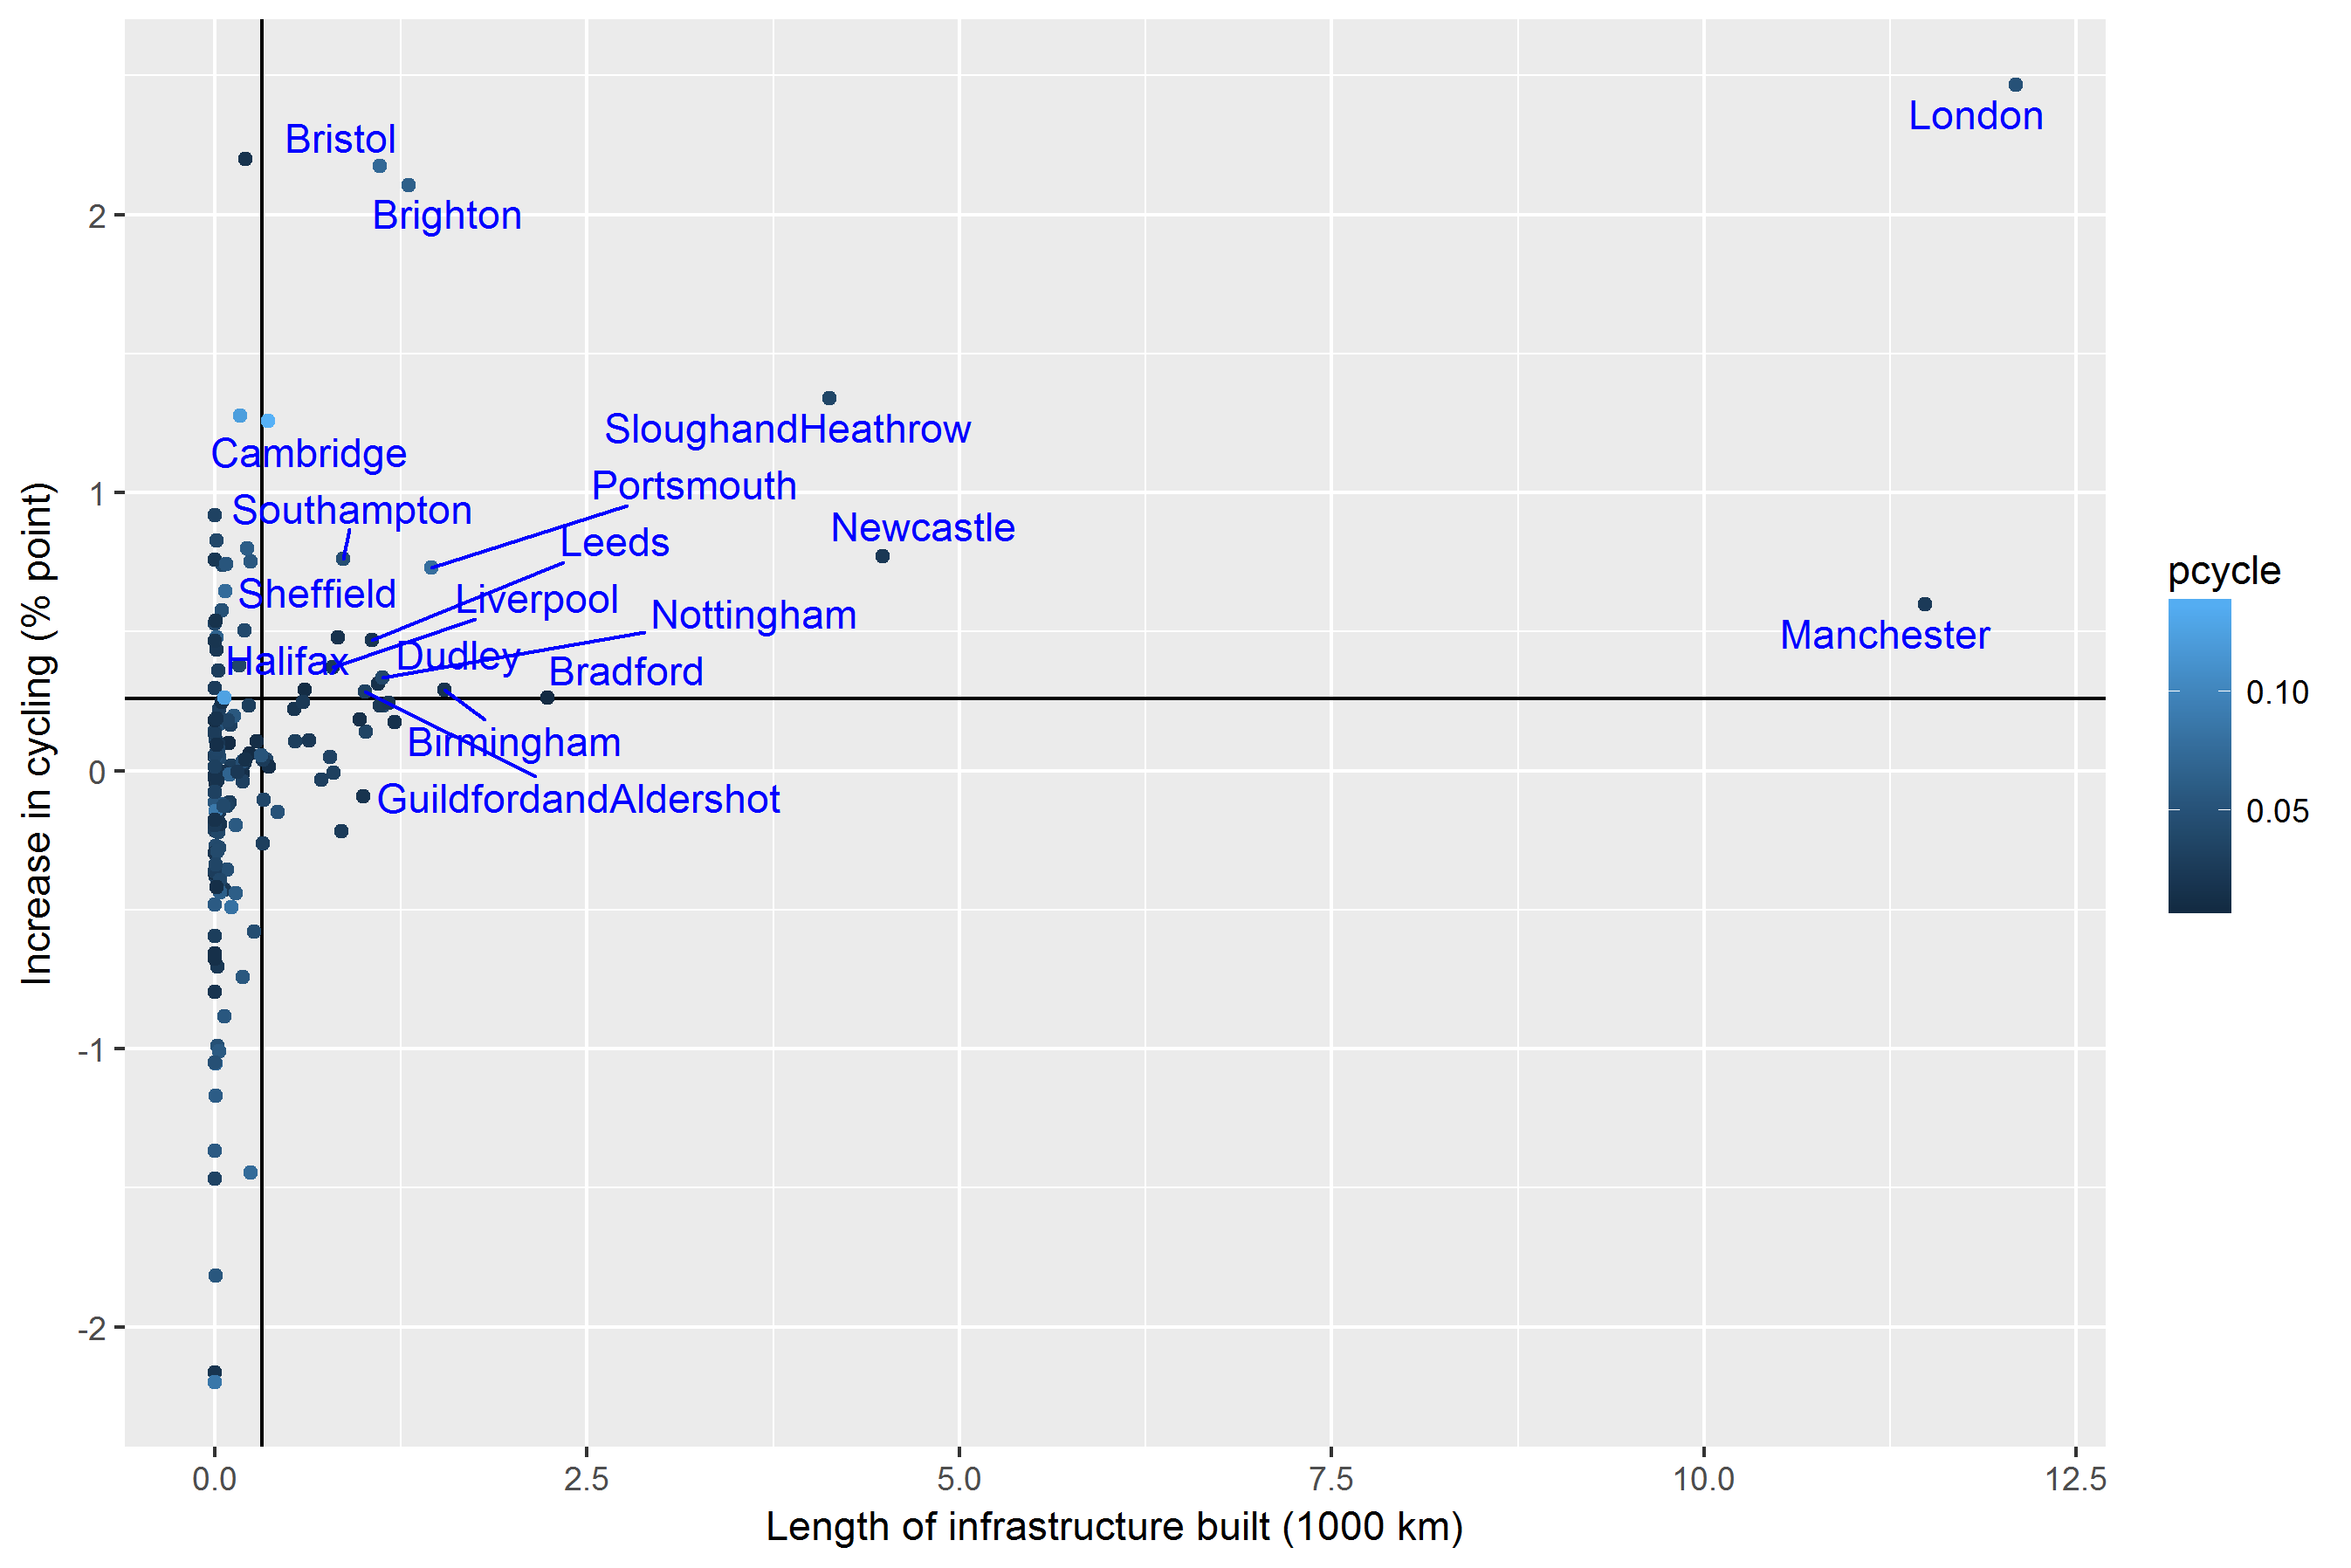
Data on infrastructure-uptake at a regional level
- Clear link between infrastructure and uptake
New datasets:
- DfT’s Transport Direct data
- 2001 OD data (manipulated and joined with 2011 data)

Operationalising the data
See: https://www.cyipt.bike (password protected)


Live demo
Set-up
The purpose of this session is to get you more familiar with the PCT and the CyIPT in some real world scnearios.
- Divide into teams of 3-4 people and select and an area to study. Choose a large city and surroundings (see English regions on http://www.pct.bike/ for ideas).
- Ensure that at least 1 person in each group has a laptop.
Assessing cycling potential with the PCT
- Using the interactive interface answer:
- What’s the current level of cycling in the study region?
- Which part of the region has the highest level of cycling?
- Which routes have the highest level of cycling to work (hint: use the Route Network (LSOA) option from the Cycling Flows dropdown menu)?
- Does those routes have infrastructure already? (hint: use the cycle map base map or go to CyIPT.bike )
- Where are cycling levels projected to grow most? Is it where there is already the highest levels of cycling?
- What are the policy implications?
Next steps: How to use open tools for planning
Using open source software
- Online interfaces reduce barriers
- But there are benefits of running analysis locally
- Various software options, including:
- QGIS mapping software
- sDNA QGIS plugin
- Key feature of CyIPT and PCT:
- Open source and provides open data downloads ## Next steps
- Take a look at the data provided at www.pct.bike: can it provide useful insight into areas you’re looking?
- In terms of policy: how can you use data to show not only what is, but what could be?
- Use multiple sources and geographic scales effectively - see transport chapter in Geocomputation with R book.
- Creating an active transport toolkit for cities internationally
- Must be based on local needs
Links + references
- The PCT in action: http://www.pct.bike/
- Event this afternoon: Geocomputation with R book launch
- Resource on R for transport: http://geocompr.robinlovelace.net/transport.html
Lovelace, Robin, Anna Goodman, Rachel Aldred, Nikolai Berkoff, Ali Abbas, and James Woodcock. 2017. “The Propensity to Cycle Tool: An Open Source Online System for Sustainable Transport Planning.” Journal of Transport and Land Use 10 (1). https://doi.org/10.5198/jtlu.2016.862.
Lowry, Michael B., Peter Furth, and Tracy Hadden-Loh. 2016. “Prioritizing New Bicycle Facilities to Improve Low-Stress Network Connectivity.” Transportation Research Part A: Policy and Practice 86 (April): 124–40. https://doi.org/10.1016/j.tra.2016.02.003.