Errors in Hypothesis Testing; Linear Regression
M. Drew LaMar
February 1, 2019

Class announcements
Hypothesis testing
Hypothesis testing (how it's done)
Hypothesis testing (how it's done)
Hypothesis testing
Hypothesis testing
The following figure shows the null distribution for the number of mothers out of nine guessing correctly.

Hypothesis testing
The following figure shows the null distribution for the number of mothers out of nine guessing correctly.
Hypothesis testing
So, P = 0.04. Is that good?

Hypothesis testing
Hypothesis testing
LOTS of confusion about P-values
LOTS of confusion about P-values

Recommended practice
Caveats
Interval estimates

Jelly Beans

P-Values

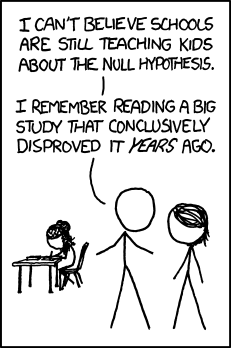
Hypothesis Testing
Errors in Hypothesis Testing

Definition:
Type I error is rejecting a true null hypothesis. The probability of a Type I error is given by \[ \mathrm{Pr[Reject} \ H_{0} \ | \ H_{0} \ \mathrm{is \ true}] = \alpha \]
Definition:
Type II error is failing to reject a false null hypothesis. The probability of a Type II error is given by \[ \mathrm{Pr[Do \ not \ reject} \ H_{0} \ | \ H_{0} \ \mathrm{is \ false}] = \beta \]
Errors in Hypothesis Testing

Errors in Hypothesis Testing - Power
Definition: The
power of a statistical test (denoted \( 1-\beta \)) is given by \[ \begin{align*} \mathrm{Pr[Reject} \ H_{0} \ | \ H_{0} \ \mathrm{is \ false}] & = 1-\beta \\ & = 1 - \mathrm{Pr[Type \ II \ error]} \end{align*} \]
Probability of errors in hypothesis testing

- \( \alpha \) is the significance level
- \( 1-\beta \) is the power
Statistical power example
https://qubeshub.org/tools/statpowerviz/