A recent survey by Slicksdeals.net shows that an average person spent $450 a month on impulsive buy.

A survey done by Creditcards.com shows that 68% of Impulse purchases are done in a physical store

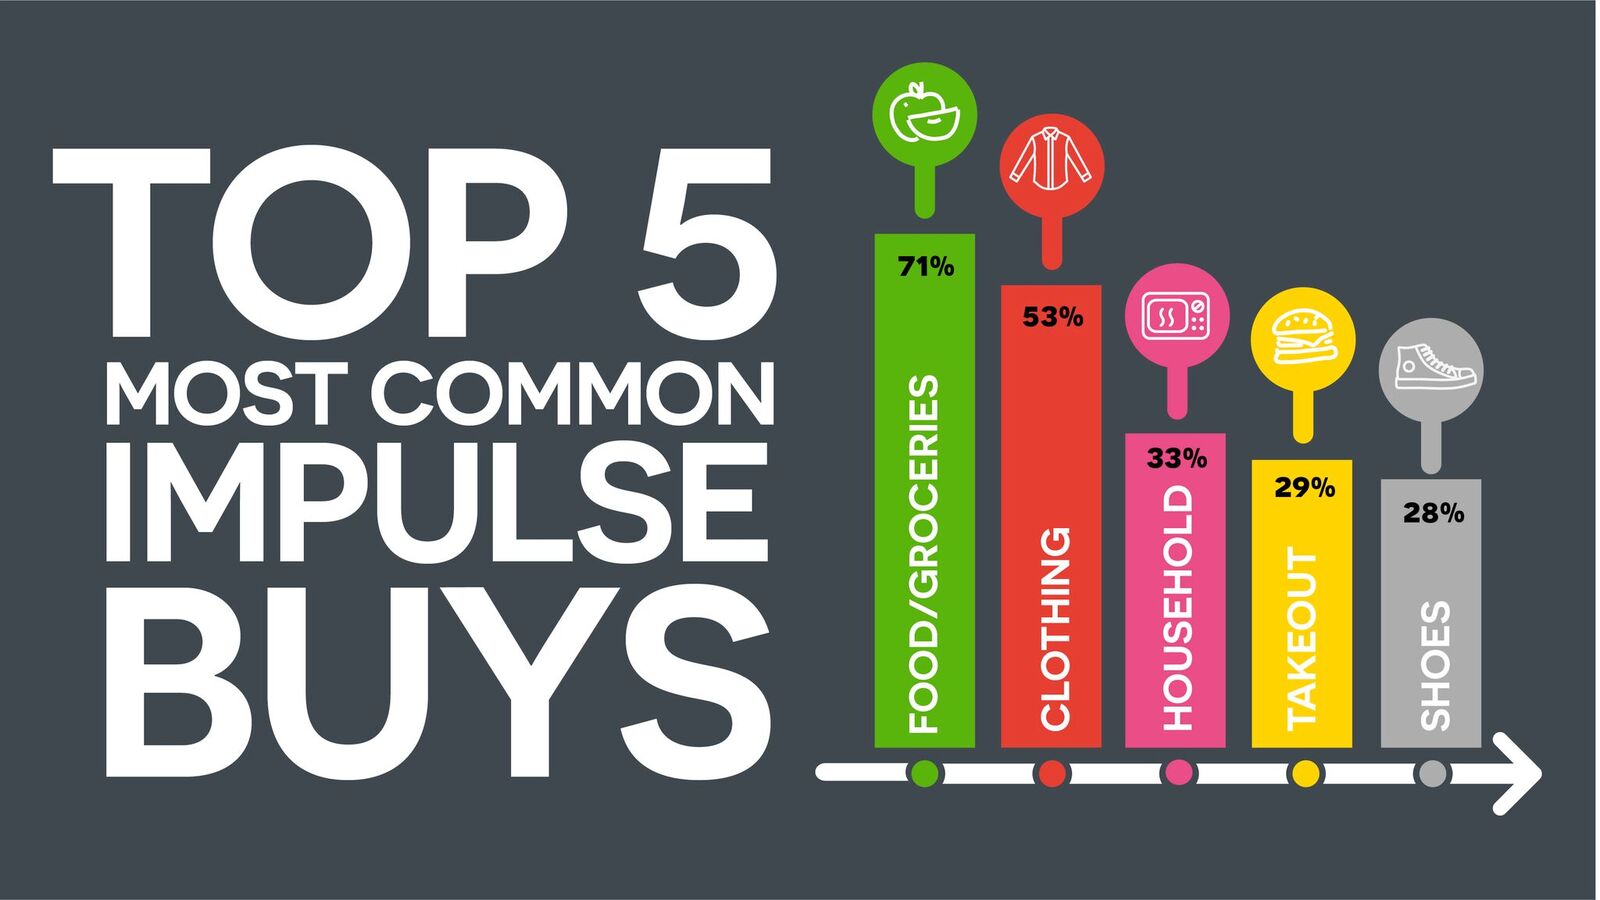
The above infographic by Slickdeals highlights the top 5 most common type of impulse purchases.
Study also shows that a planned shopping trip can reduce impulsive shopping by 13%
Background
The Shiny App that will be presented is a Women Shoes Recommender that recommend users a list of shoes based on criteria specified by users.
Shiny App:https://michaelnai.shinyapps.io/Shoes_shiny/
Github: https://github.com/michaelnai/ShinyShoes
Data source: Kaggle https://www.kaggle.com/datafiniti/womens-shoes-prices
Problem Statement
Impulse purchase is the consequence of an unplanned shopping trip and it causes unnecessary expenditure.
Objective
To help planning one's shopping trip for shoes by:
• Many columns were deemed irrelevant to our usage hence only columns needed for the purpose of creating the App are selected.
• Prices are all normalized to USD.
• Measurement of weights are standardized to KGs.
• NAs in Brand column are imputed with “Others”.
• Observations with NA in the needed columns are removed.
• Observations with NaN in the average price column are removed.
• The dataset used was really messy to start with and explanation of the features from the source are not clear.
• Reducing thousands of different colors into a more general scope of colors.
• Some of the features are duplicated record, because two different sites can upload the same shoes. Hence to remove the duplicates we use average to aggregate these features.
• The urls are prepared in a list format (One record can have multiple urls), and to overcome this a proper flatten functions were used
• A lot of outdated URLs that cause images fail to render.