Data Visualisation Workshop - Theory
EPA Victoria - June 2018
Dr James Baglin, School of Science, Mathematical Sciences, RMIT University
Last updated: 24 June, 2018
Visual Information Processing System
- By understanding a little about our visual perception system, and it’s limitations, we can ensure we design effective data visualisation that do not deceive.

Colin Ware’s (2013) three stage model of visual information processing (p. 20)
Preattentive Processing
- What features of the following image “pop-out” to you?

Preattentive Processing Cont.
- What draws your attention?

Preattentive Processing Cont. 3

Proximity
- Objects close or clustering together are perceptually grouped.

Proximity Example

Similarity
- Objects of similar characteristics (e.g. size, shape, colour) are grouped.

Similarity Example

By Chire - Own work, CC BY-SA 3.0, Link
Connectedness
- More powerful than proximity, colour, size or shape. Objects connected by lines demonstrate relationships between objects.

Connectedness Example
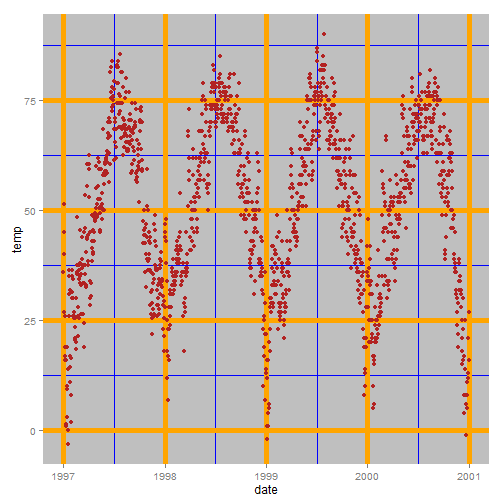
Continuity
- This law predicts that we are inclined to perceive objects from elements that are smooth and continuous, versus irregular and jagged.

Continuity Example

Symmetry
- We tend to group symmetrical objects together.

Symmetry Example

Closure
- Closure refers to our tendency to “fill in the gaps” when we see incomplete patterns that resemble familiar shapes and objects.

Closure Example

Figure Ground Principle
- The figure ground effect tells us that smaller objects within a figure are interpreted as the foreground, while larger objects make up the ground.

Figure Ground Principle Example
Common Fate
- Objects perceived to be moving in the same direction are grouped together and share a common path.

Visual Variables

Visual Comparison Accuracy

Activity 2 - Deconstruct
- Working with your partner or in a small group, discuss the perceptual issues associated with pie charts.

Quick Quiz 2

- Let’s do a quick revision quiz:
- Visit https://b.socrative.com/login/student/
- Room Name: DATAVIS
- Enter a nickname
- We will work through each question as a group