library(plotly)
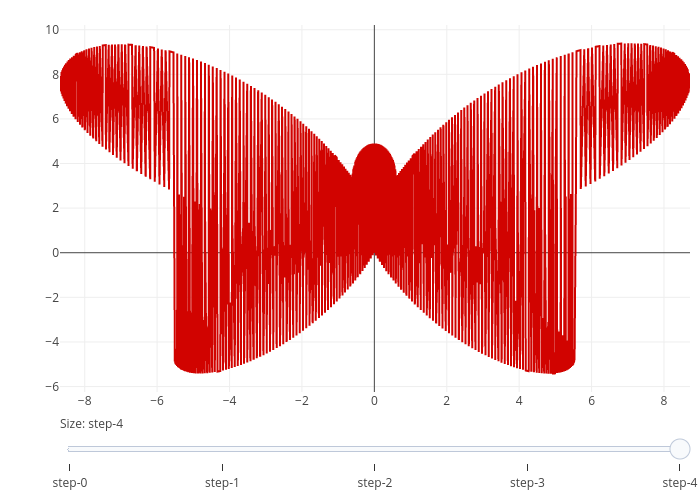
#Plot the Butterfly Curve - https://en.wikipedia.org/wiki/Butterfly_curve_(transcendental)
t <- seq(0, 2 * pi, length.out = 1000)
# create data
aval <- list()
for(step in 1:5){
aval[[step]] <-list(visible = FALSE,
name = paste0('v = ', step),
x = step * sin(t) * (exp(cos(t)) - 2 * cos(4 * t) - sin(t / 12) ^ 5),
y = step * cos(t) * (exp(cos(t)) - 2 * cos(4 * t) - sin(t / 12) ^ 5)
)
}
aval[3][[1]]$visible = TRUE
# create steps, plot all traces
steps <- list()
p <- plot_ly()
for (i in 1:5) {
p <- add_lines(p,x=aval[i][[1]]$x, y=aval[i][[1]]$y, visible = aval[i][[1]]$visible,
name = aval[i][[1]]$name, type = 'scatter', mode = 'lines', hoverinfo = 'name',
line=list(color='D10300'), showlegend = FALSE)
step <- list(args = list('visible', rep(FALSE, length(aval))),
method = 'restyle')
step$args[[2]][i] = TRUE
steps[[i]] = step
}
# add slider
p <- p %>% layout(sliders = list(list(active = 4, currentvalue = list(prefix = "Size: "), steps = steps)))
chart_link = api_create(p, filename="sliders-butterfly-slider")
chart_link