Firearm Suicide: The Hidden Side of Gun Violence

Jim Scotland
April 24, 2018

Overview

  • Shed light on hidden issue of firearm suicide
  • Frame issue relative to homicide deaths and overall suicide
  • Explore potential impact of region, laws and ownership rates
  • Develop regression model to predict gun suicides
  • Use machine learning to assess critical gun law interventions

The Problem

  • The individual most likely to kill a gun owner is himself
  • Suicides made up 60% of gun deaths in 2016
  • Almost 23,000 firearm suicides in 2016 and trend is rising
  • In 44 states, rate of gun suicide exceeds gun homicide
  • The greatest risk to a gun owner is their own gun

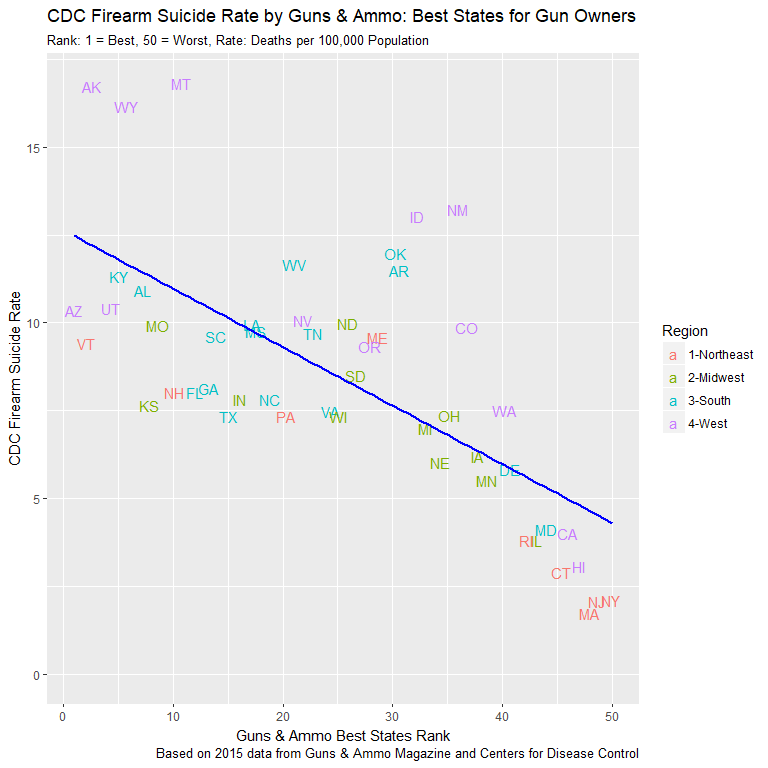
Best States for Gun Owners?

guns_ammo_vs_fsr

  • Guns & Ammo state rankings find curious correlation
  • MT ranked 11th by G&A, 1st in gun suicides
  • MA ranked 48th by G&A, 50th in gun suicides
  • What exactly does “Best for Gun Owners” mean?

Firearm Suicide as Target of Study

  • Firearm suicide takes more lives than homicide
  • Vast majority of states face far higher firearm suicide rates
  • Suicide is more critical problem in rural states
  • Suicide methods and trends vary across regions
  • Within regions, gun suicides drive higher rates in rural states

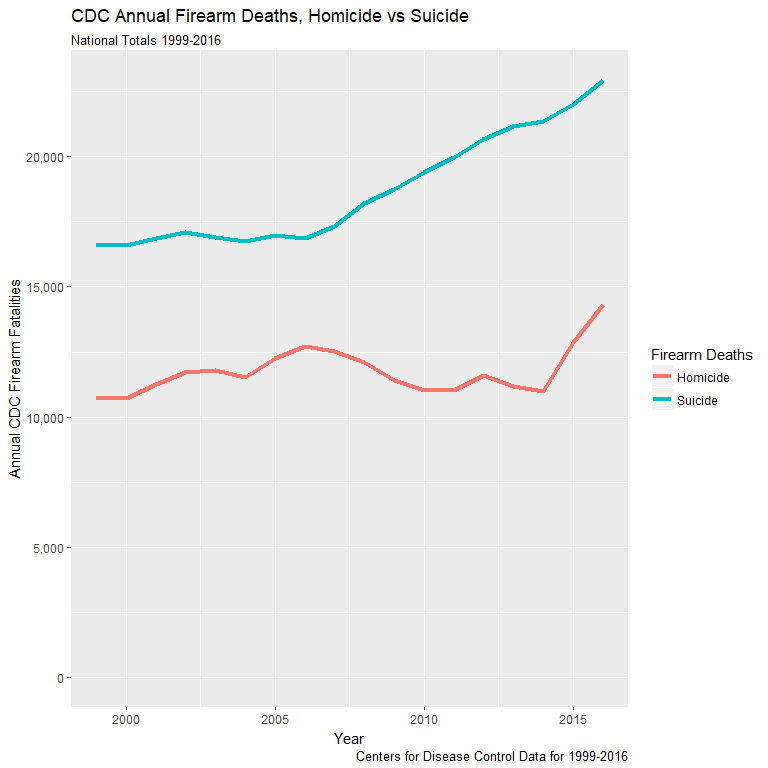
Suicide Takes More Lives, Getting Worse

sui_vs_hom_line

  • Firearm suicides historically outpace homicides
  • Sharp and steady rise in suicides since 2008
  • Firearm homicides more stable but spiking recently

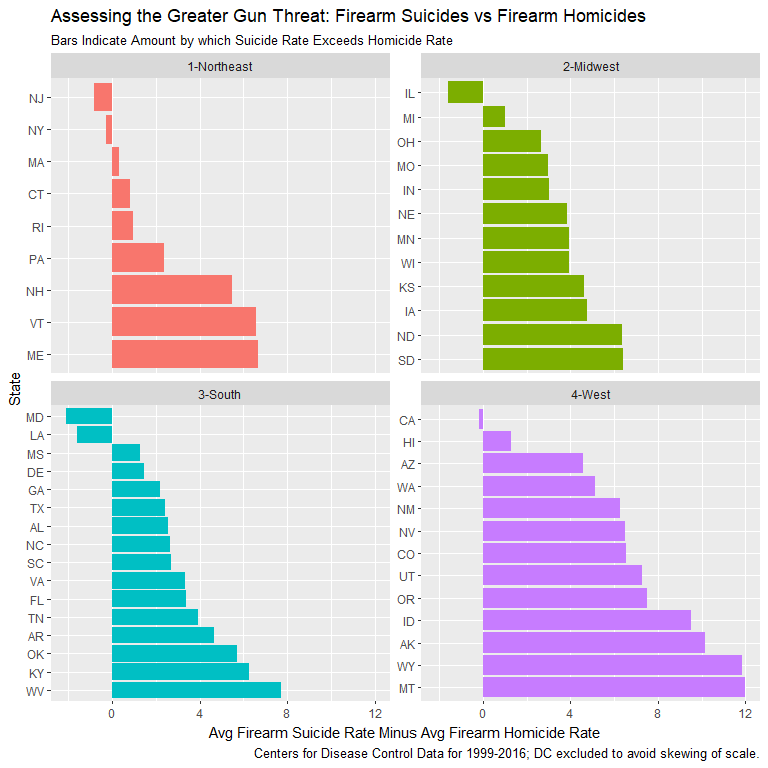
Firearm Suicide Minus Firearm Homicide

fsr_minus_hsr

  • Firearm suicide rate 2X homicide rate on average
  • Disparity greater in rural states
  • Only six states w/ higher homicide rate

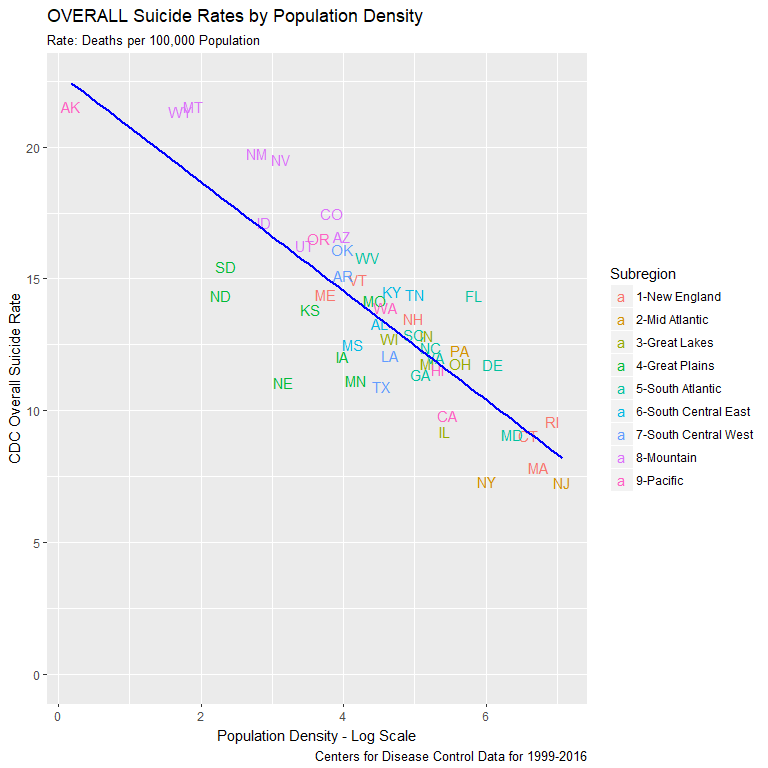
Suicide Rates Higher in Rural States

osr_by_pop_density

  • Sparsely populated states face higher suicides
  • Mountain states experience most extreme levels
  • Similar Plains states all well below Mountain rates
  • Northeast posts lowest suicide rates

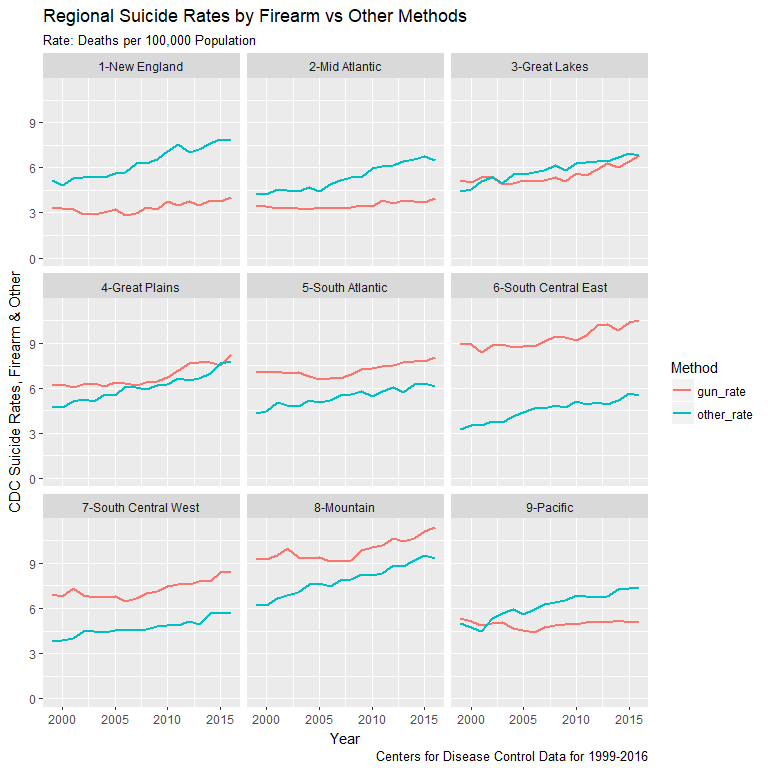
Regional Variations in Suicide Modality

Regional Suicide Profiles

  • Firearm suicide rate (FSR) lower and trendline flatter in Northeast and Pacific
  • FSR sharply higher and rising in South and Mountain regions

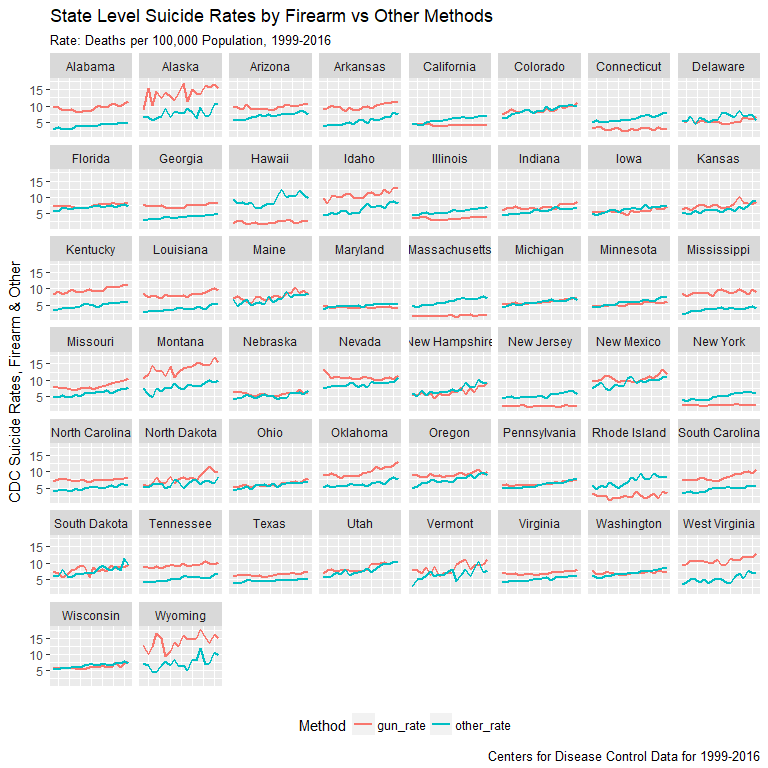
Rural vs Urban Divide within Regions

State Suicide Profiles

Examples of Regional Divide

  • Massachusetts vs Maine
  • New York vs Pensylvania
  • Illinois vs Indiana
  • Texas vs Oklahoma
  • California vs Oregon

Guns Drive Above Average Suicide Rates

  • Since 1999, guns accounted for 58% of deaths in states with above average suicides
  • They account for 48% of deaths in below average states
  • In three lowest suicide rate states, guns account for 22%-32% of deaths
  • In three highest rate states, guns are used in 63%-65% of suicides

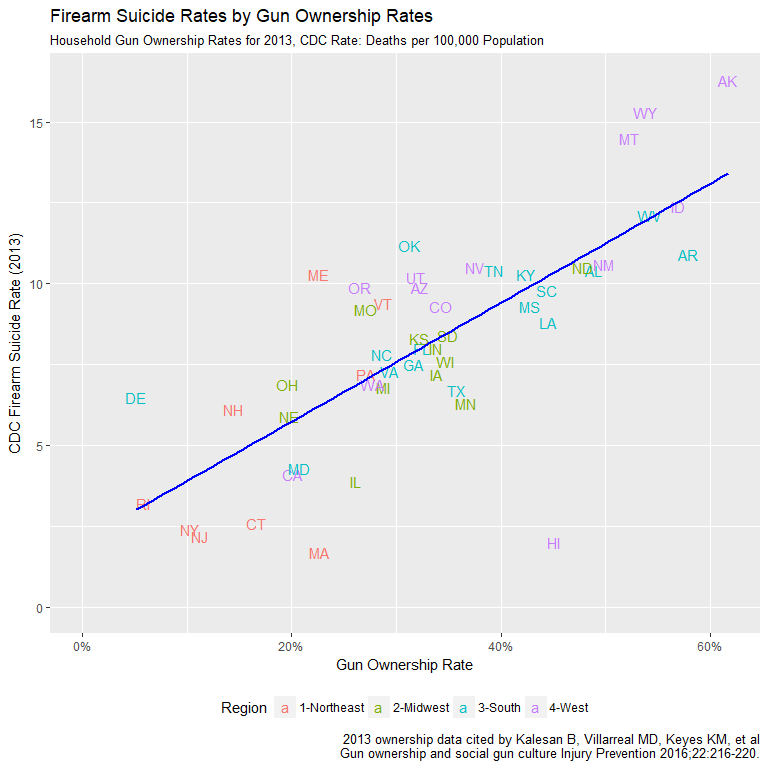
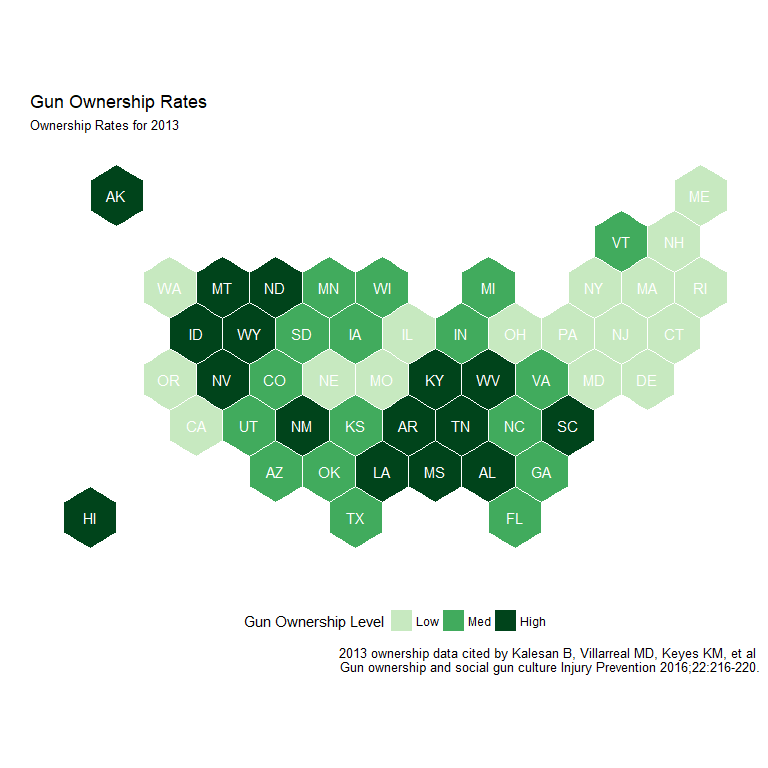
Gun Ownership and Firearm Suicides

  • Gun ownership data from 2013 Kalesan survey
  • Strong relation between higher gun ownership and higher suicide rates
  • Regional and rural/urban variations are evident
  • Ownership data for one year only limits analysis

More Guns, More Gun Suicides

own_fsr_plot

  • Ownership rates strongly correlated with FSR
  • Correlation of 0.748 and r-squared of 0.559
  • Divide between rural and urban apparent again

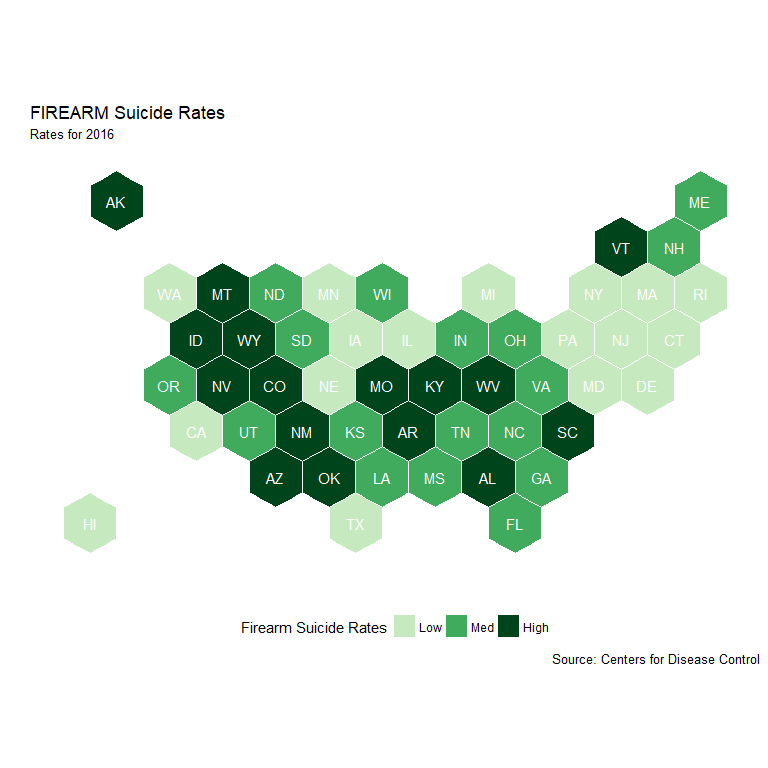
Mapping Gun Ownership and FSR Levels

own_rate_map

fsr_rate_map

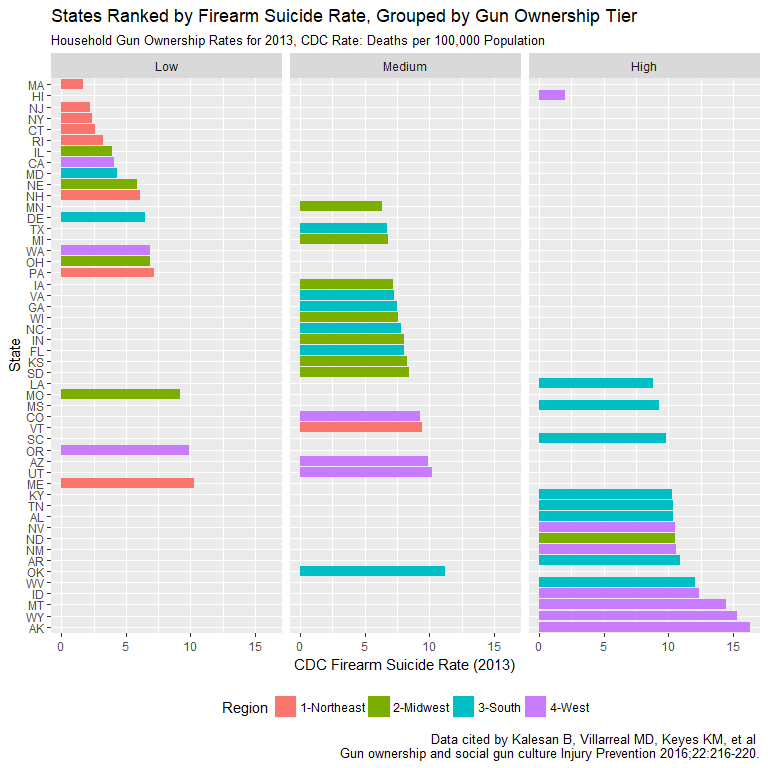
Ownership Tier and Firearm Suicide Rates

fsr_own_tier

  • High ownership tier has 12 of 13 highest FSR states
  • Low ownership tier has 11 0f 13 lowest rates
  • Hawaii data likely incorrect (see full report)

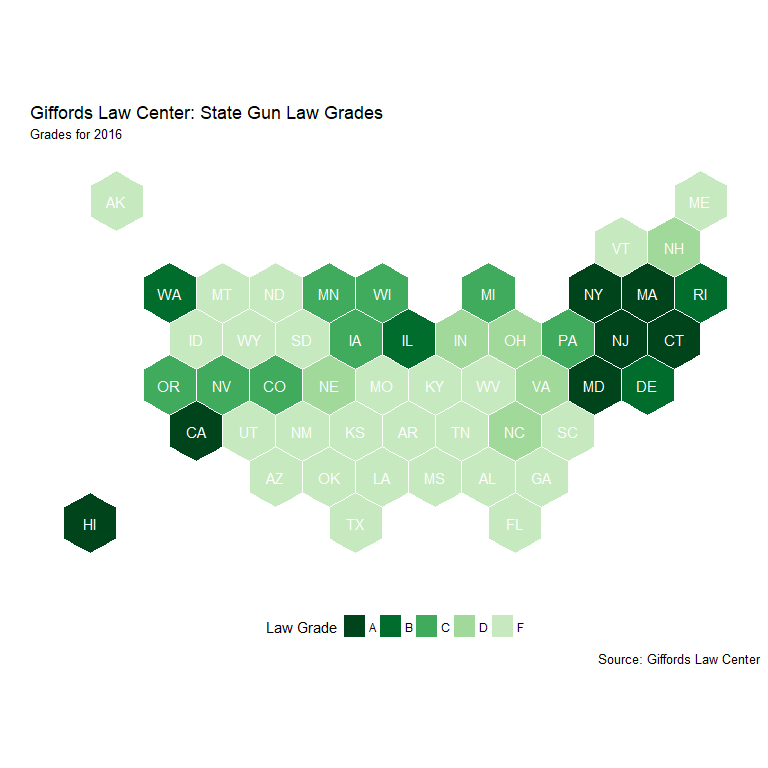
Giffords Gun Law Grades

  • Giffords Law Center Data for 2014-2016
  • Ratings show relation between weak laws and gun deaths
  • Rankings also display relation with firearm suicide rates
  • Data limited to three years impacting deeper exploration

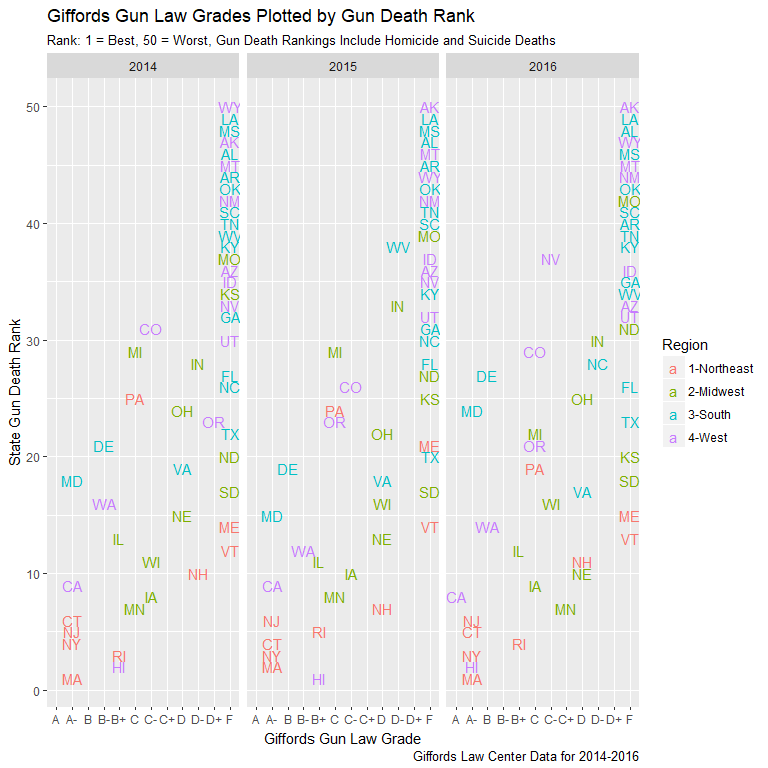
Giffords Grades and Gun Deaths

giff_grd_gun_dth_rnk

  • Half of states receive gun law grade of “F”
  • Worst gun death ranks dominated by “F” states
  • States with A-B grades boast lowest gun deaths
  • Similar relationship for firearm suicides

Mapping Giffords Grades and FSR Levels

giff_grd_map

fsr_rate_map

F-Grade and Overall Suicide Rates

osr_by_f_grade

  • 41 Above/Below Average rankings indicated by Giffords “F”
  • 21 “Non-F” states below average
  • 20 “F” states above average
  • Clear prevalence of gun suicides in above average states

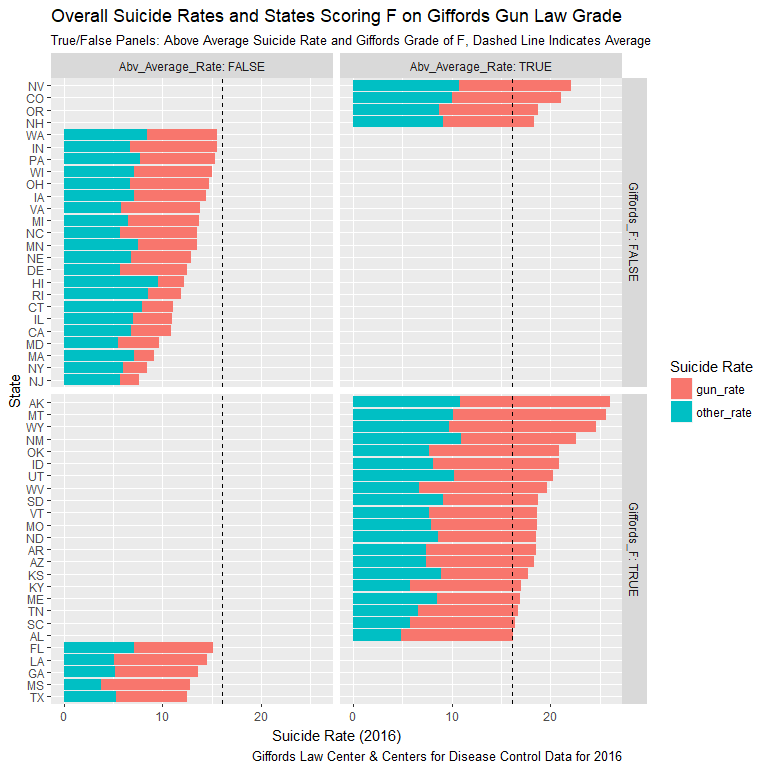
Strong Laws, Fewer Firearm Suicides

  • Gun regulation varies widely by state and region
  • Increased regulation largely limited to coastal states
  • Strong relation between regulation and firearm suicides
  • Reduced gun laws, increased FSR deaths

Gun Regulation Varies by State & Region

law_state_plots

  • Number of laws and trends wildly disparate
  • Variation mirrors rural-urban divide within regions
  • Northeast has strongest gun laws nationally
  • Maine & Vermont laws closer to South or Mountain West

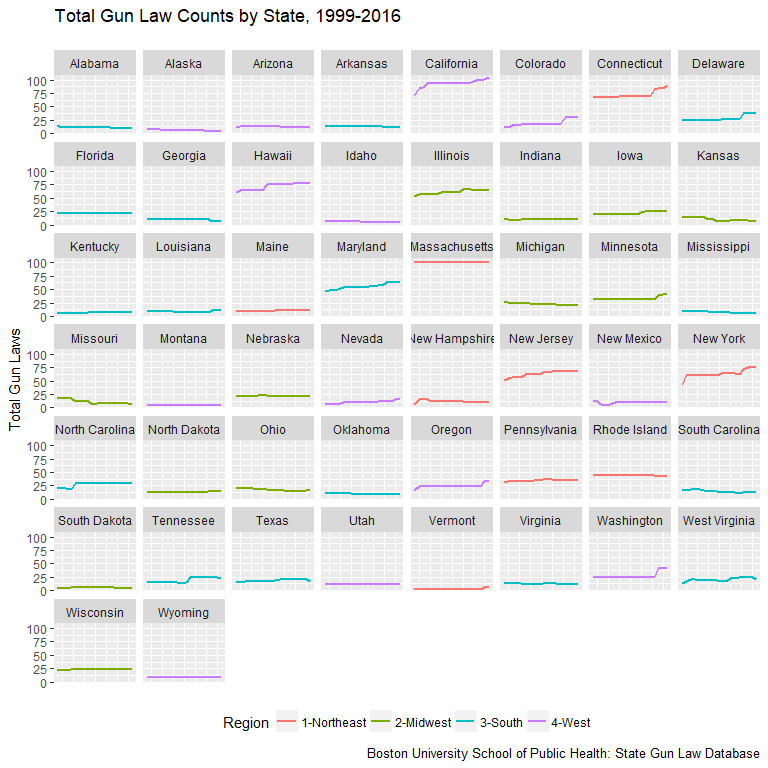
Increased Regulation on Coasts

law_net_chg

Gun Law Changes 1999-2016

  • Significantly increased regulation (10+ laws) in only 12 states
  • Increases concentrated on East and West coasts
  • Laws decreased in 18 states across South, Midwest and West

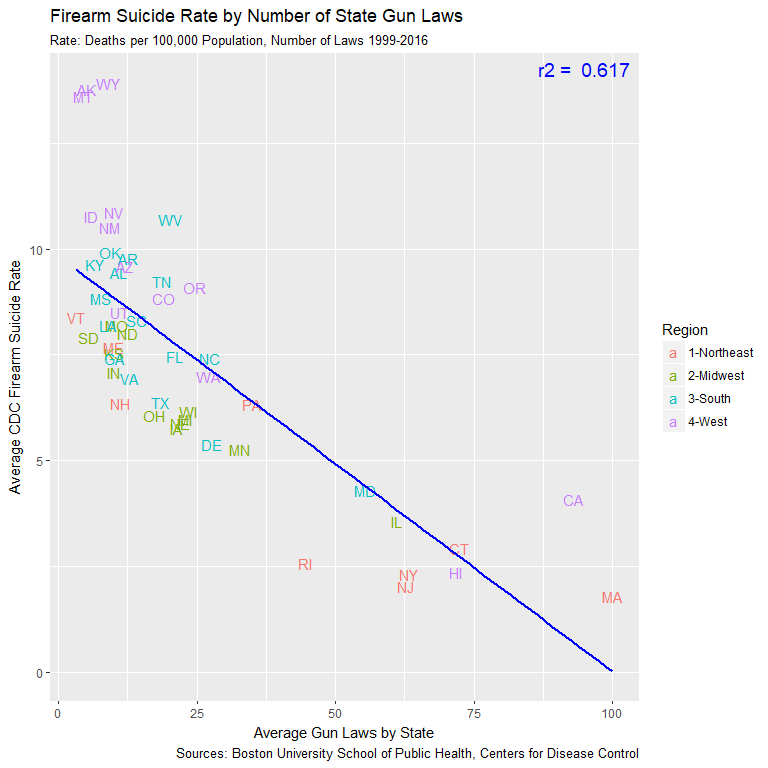
Laws Strong Indicator of FSR Level

laws_vs_fsr_all

  • Number of laws explains 61.7% of variation in state FSR levels
  • High regulation coastal states have far lower FSRs
  • Western states dominate the low regulation, high FSR corner
  • Plot presents reversed mirror image of earlier ownership plot

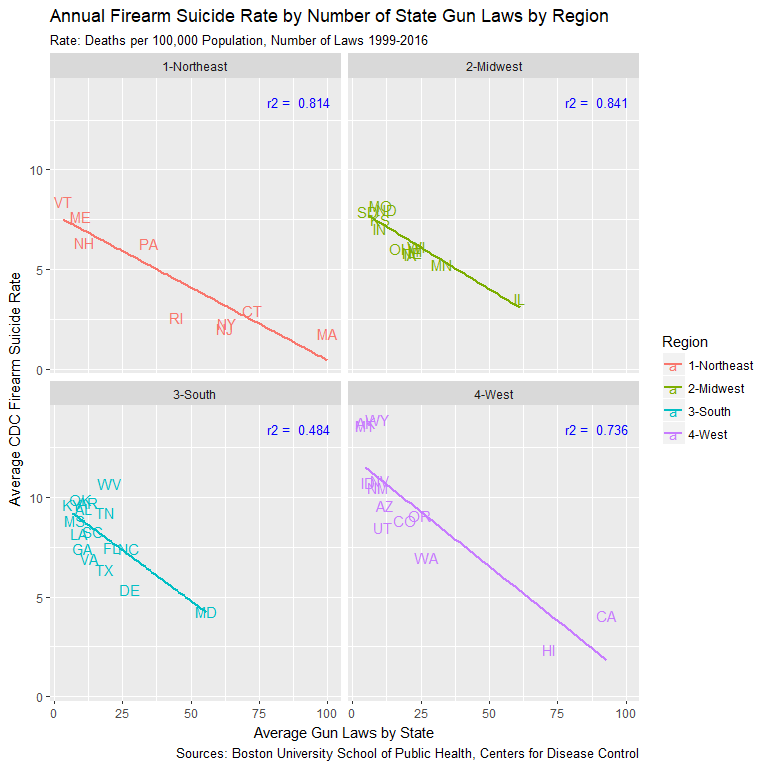
Relationship Stronger at Regional Level

laws_vs_fsr_reg

  • Regional plots call out rural vs urban divde once more
  • R-squared values markedly higher by region
  • AK, WY, MT remain unfortunate outliers at top of FSR range

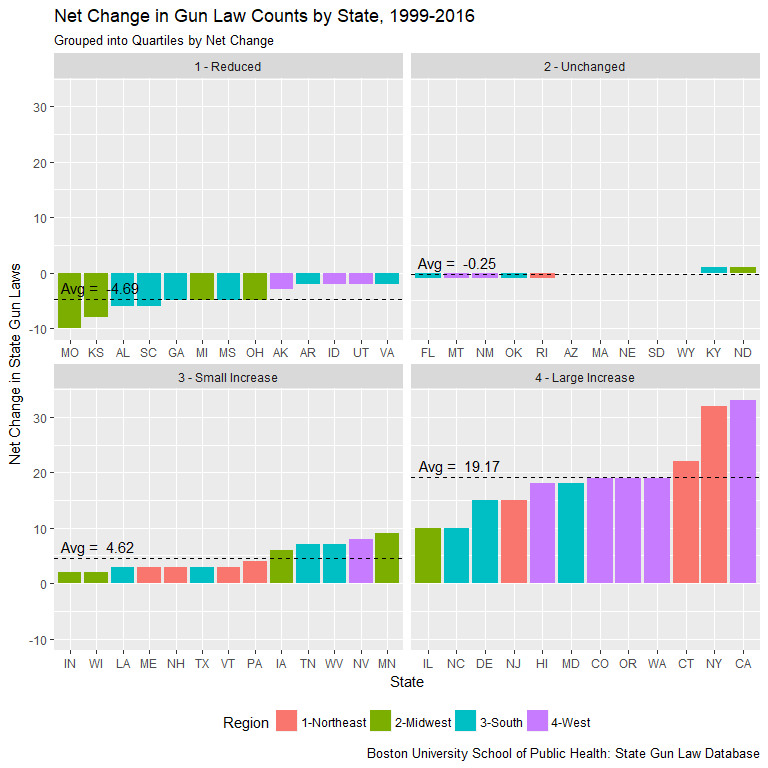
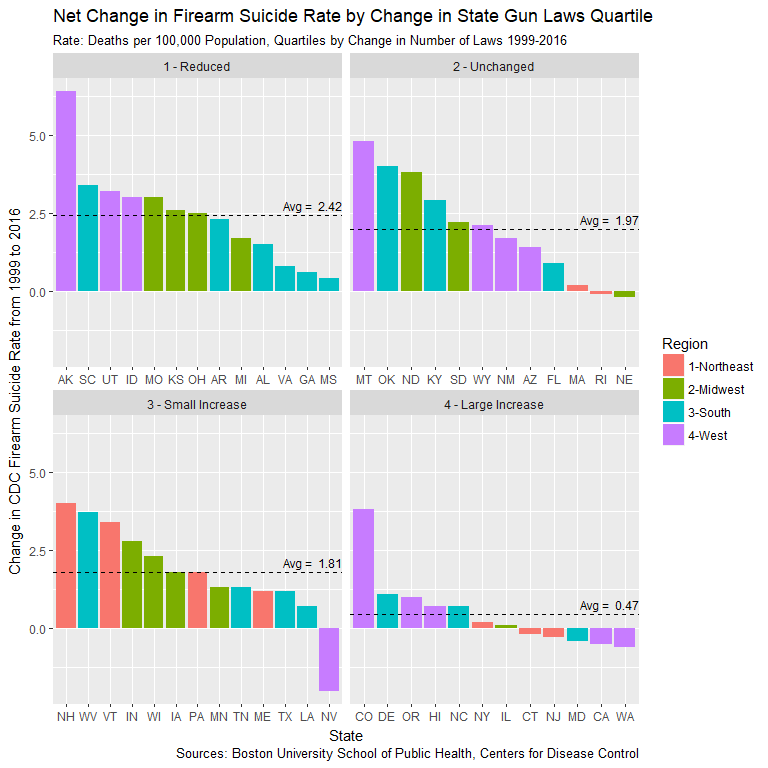
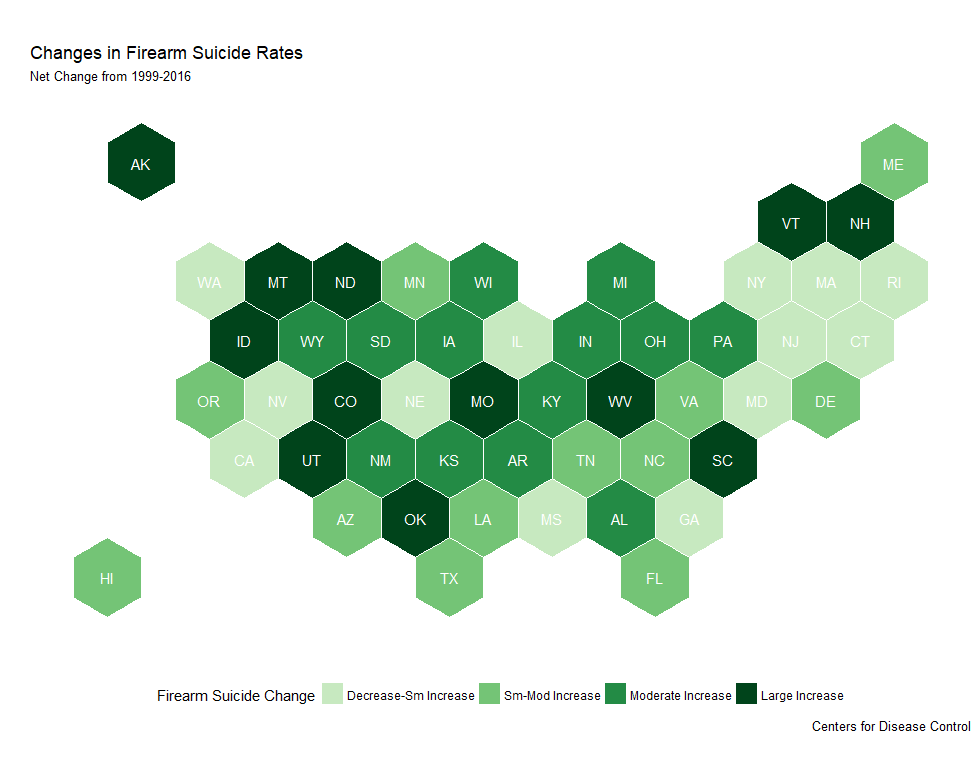
Reduced Gun Laws, Increased FSR Deaths

law_chg_fsr_chg

  • Reduced gun law states averaged 2.42 increase in FSR
  • Large increase states (10+ laws) saw only 0.47 increase
  • 5X difference in FSR change between two groups
  • Changes occur amid rise in national suicide rates

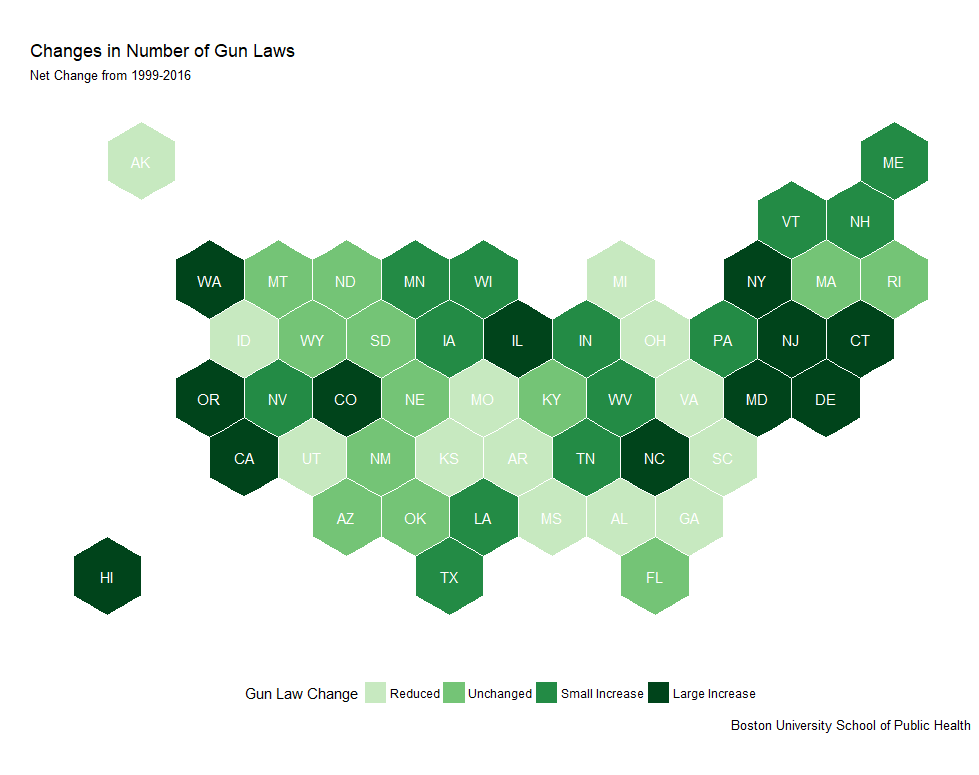
Mapping Law Change to FSR Change

map_law_chg

map_fsr_chg

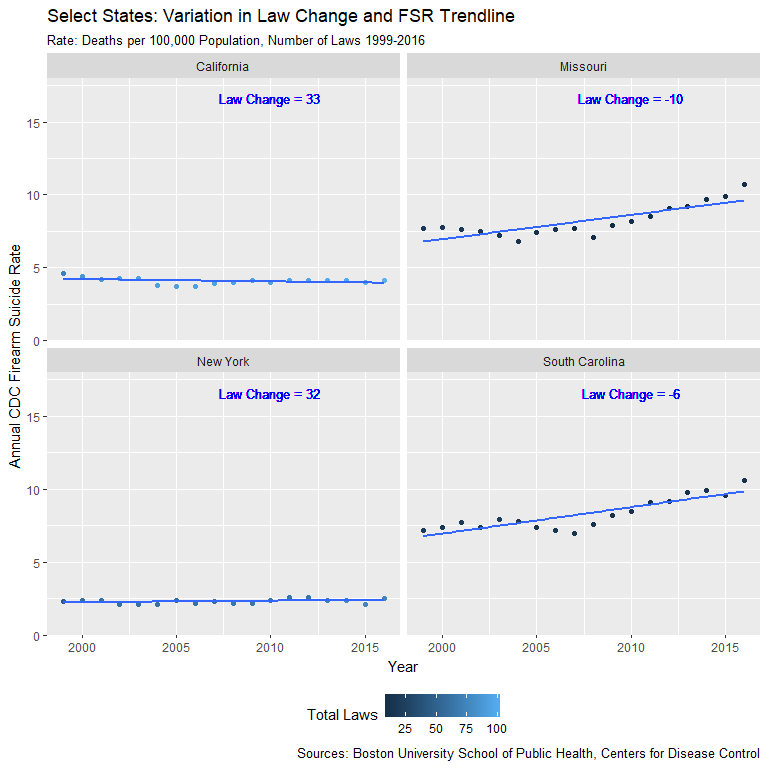
Select State Comparisons

ca_mo_plot

  • California +33 gun laws, FSR fell 0.5/100K
  • Missouri -10 gun laws, FSR rose by 3.0/100K
  • Estimated 176 more Missouri suicides in 2016
  • Estimated 183 lives saved in California
  • NY: 39 saved lives, SC: 151 more deaths

Regression Model to Predict State FSR

VARIABLES OF INTEREST

  • Gun Ownership Rate
  • Firearm Laws
  • Region
  • Population Density

POTENTIAL ISSUES

  • Colinearity between variables
  • Only one year of ownership rates
  • Rising suicide rate

Training Data - 2013 Data Only

  • Ownership rate, buyer regulation laws and region West most effective variables
  • Ownership rate has greatest impact on model performance but high error range
  • Buyer regulations law category more conservative choice over total laws
  • Population density strong predictor in isolation, not in combination
  • Region = West outperformed all other regional variable options
  • Model predicted 82.5% of variation in FSR on the 2013 training data

Model Performance on Test Data

man_reg_ggplot

  • Model accounted for 77.3% of FSR variation in test data
  • RMSE of 1.68 improved on train data performance
  • Significant size difference in datasets likely cause of shifts
  • Variation at high end of FSR range difficult to predict

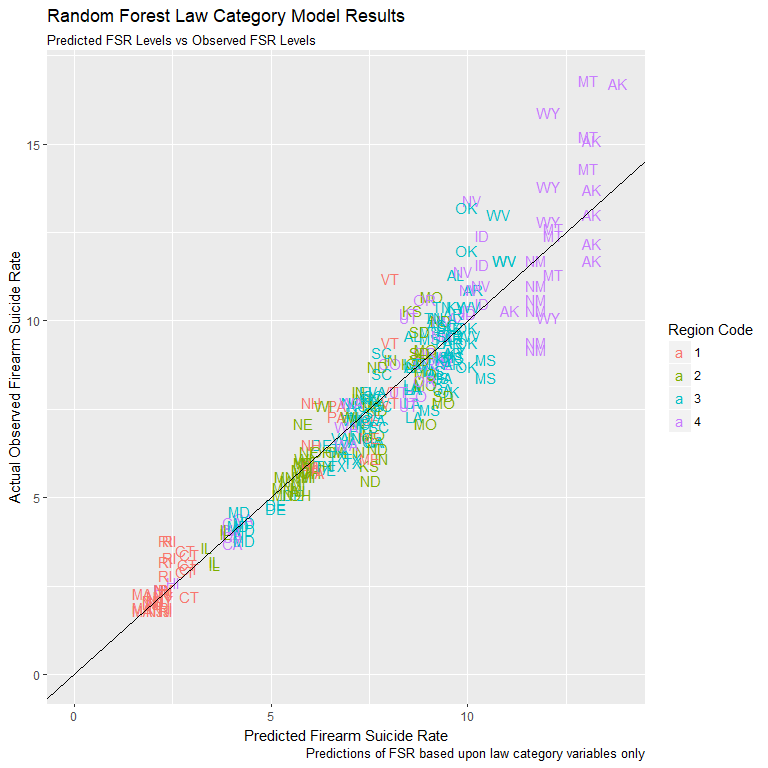
Random Forest: Law Categories Only

  • Random Forest machine learning technique for higher accuracy
  • Inability to see how model achieves improved performance
  • Run to explore possibility of using only law variables
  • Higher risk of overfitting model to training data
  • Train with 70% of data, test on 30%

Random Forest Model Performance

rf_ggplot_test

  • Random Forest model outperformed manual regression
  • Used only 14 law category variables
  • Accounted for 90.4% of FSR variation
  • RMSE of only 0.945

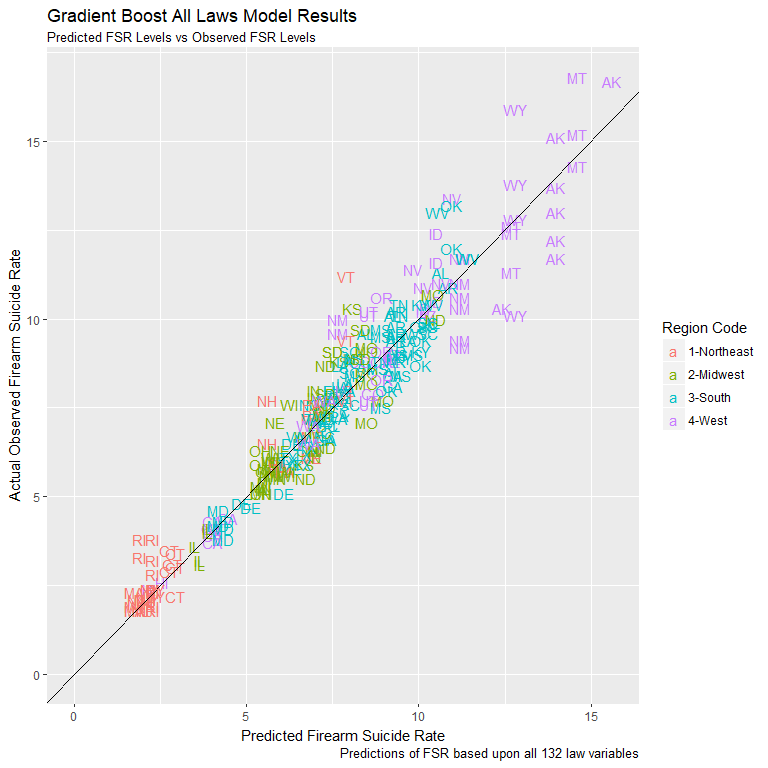
Gradient Boost Model: All Law Variables

  • Gradient Boost machine learning technique similar to Random Forest
  • Allows one to glimpse variable impact
  • Apply using 132 individual law variables
  • Assess law variables most likely to effect FSR levels
  • Repeat 70/30 training vs test data split

Gradient Boost Model Performance

gb_ggplot

  • Outperformed Random Forest law category model
  • Accounted for 92.3% of variation in FSR
  • RMSE even lower at 0.85

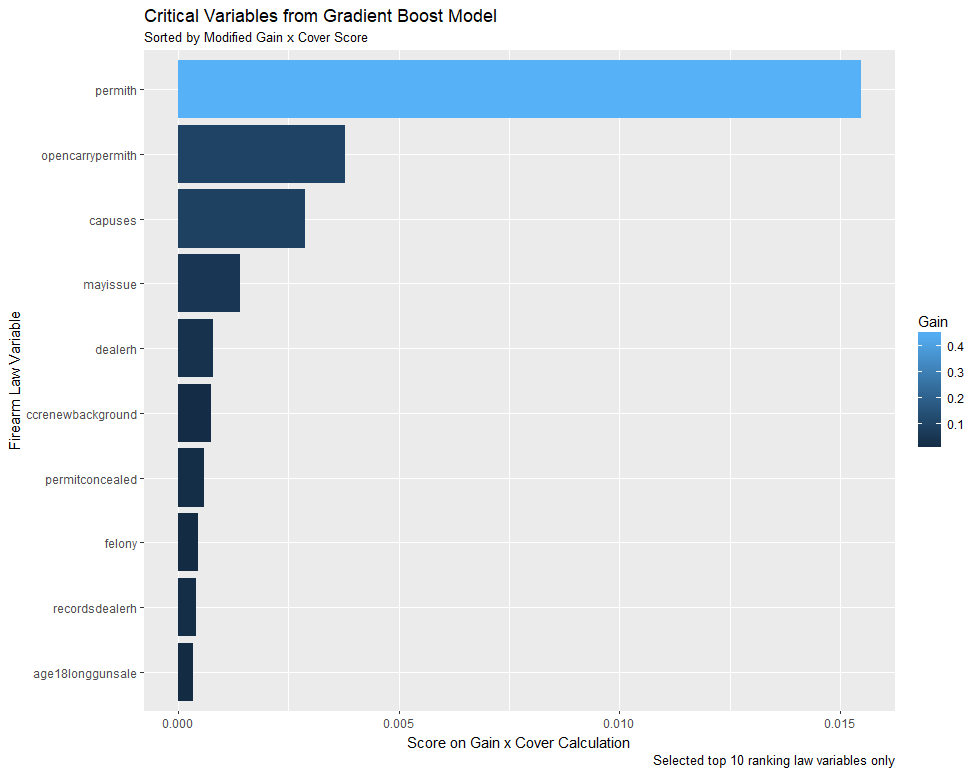
Critical Variables in Model

crit_var_ggplot

  • Plot displays critical variables ranked by gain x cover
  • Gain indicates improvement in model accuracy
  • Cover indicates number of branches effected
  • permith clearly stands out in ranking
  • permith: A license or permit is required to purchase handguns

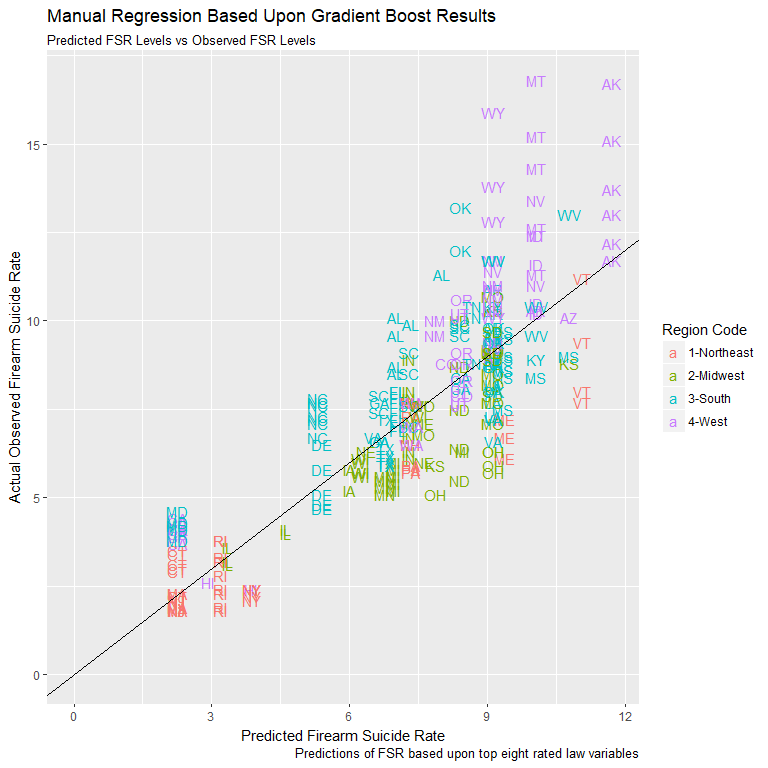
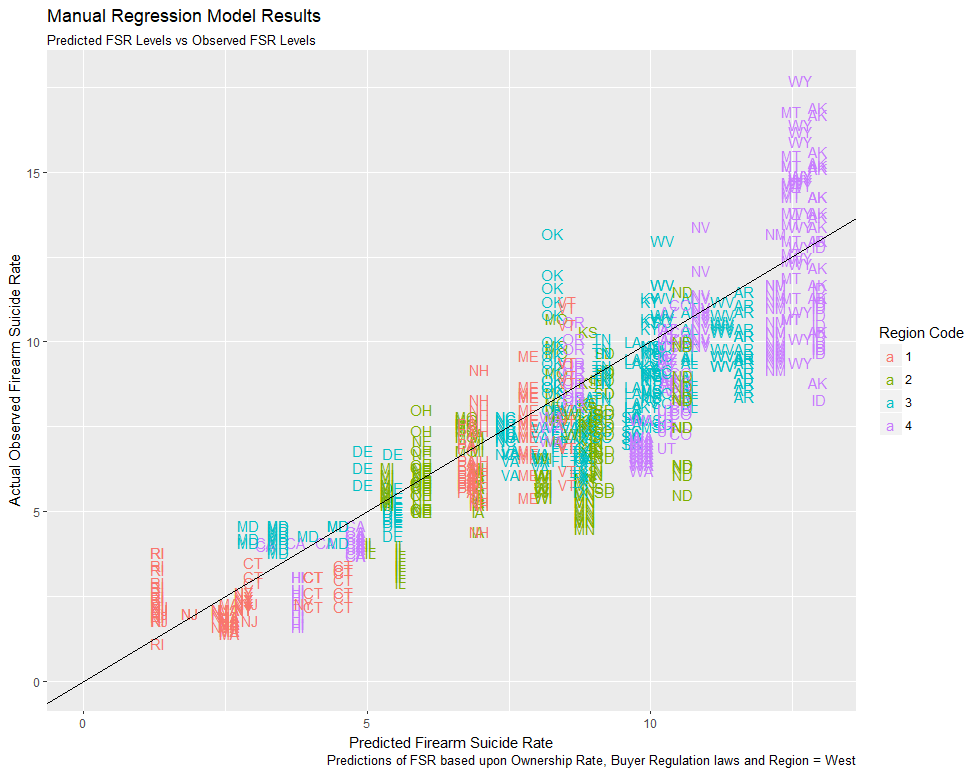
Manual Regression Using Critical Laws

gb_man_ggplot

  • Built manual regression model using critical law variables
  • Dropped two during model build for lack of impact
  • Model accounts for 70.9% of FSR variation using 8 laws only
  • Less accurate than initial manual regression but respectable

Critical Law Variables Defined

  • permith: A license or permit is required to purchase handguns
  • opencarrypermith: No open carry of handguns is allowed in public places unless the person has a concealed carry or handgun carry permit
  • capuses: Criminal liability for negligent storage of guns if child uses or carries the gun
  • mayissue: “May issue” state (granting of cc permits at discretion of local authorities)
  • dealerh: State dealer license required for handgun sales
  • ccrenewbackground: Concealed carry permit renewal requires a new background check
  • permitconcealed: Permit required to carry concealed weapons
  • recordsdealerh: Record keeping and retention required for licensed dealers for handgun sales

Conclusions

  • Gun legislation makes a difference
  • Highly regulated states have guns but fewer gun suicides
  • Pursue laws most likely to effect the suicide problem
  • Rural states are at greatest risk for firearm suicides
  • Self-protection argument is illusory
  • Deeper modeling research of law impact would be valuable

Data Sources