R-studio tutorial
Krung Sinapiromsaran
October 2014
Outline
R programming language
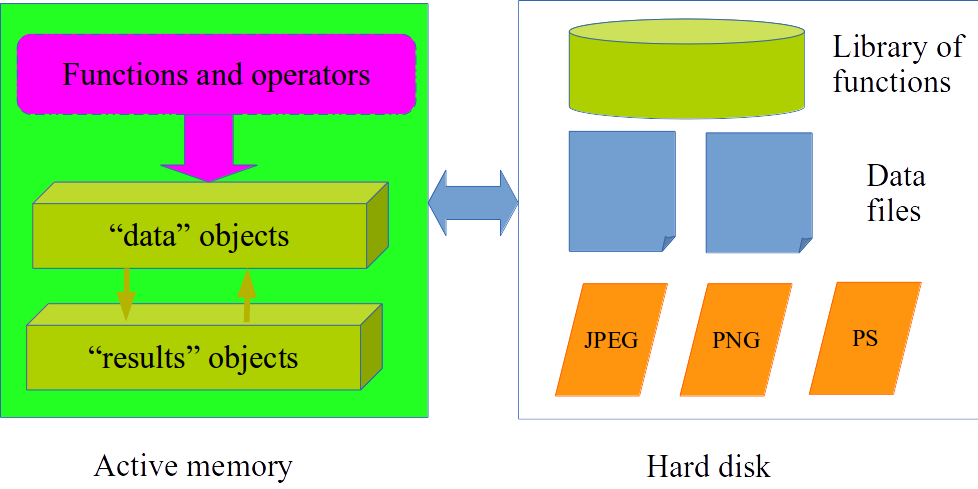
![]() is a computing environment, similar to matlab
is a computing environment, similar to matlab
- R is a high-level language based on scheme and S.
- R communicates to a user via
- console to execute one command at a time
- script to execute selection of R statements
- interactive to execute GUI commands
R history
R data structures
R advantages
R workspace
R architecture
R variables
R list
R lists
R IDE
R standard console (default)
R commander (R GUI required additional modules)
R studio (R GUI via browser offered both client and server)
RKWard (R Stand-alone GUI)
Other editors such as Emacs (http://ess.r-project.org/)

R commands
R sample commands
R example command
example(boxplot)
boxplt> ## boxplot on a formula:
boxplt> boxplot(count ~ spray, data = InsectSprays, col = "lightgray")

boxplt> # *add* notches (somewhat funny here):
boxplt> boxplot(count ~ spray, data = InsectSprays,
boxplt+         notch = TRUE, add = TRUE, col = "blue")

boxplt> boxplot(decrease ~ treatment, data = OrchardSprays,
boxplt+         log = "y", col = "bisque")

boxplt> rb <- boxplot(decrease ~ treatment, data = OrchardSprays, col = "bisque")

boxplt> title("Comparing boxplot()s and non-robust mean +/- SD")

boxplt> mn.t <- tapply(OrchardSprays$decrease, OrchardSprays$treatment, mean)

boxplt> sd.t <- tapply(OrchardSprays$decrease, OrchardSprays$treatment, sd)

boxplt> xi <- 0.3 + seq(rb$n)

boxplt> points(xi, mn.t, col = "orange", pch = 18)

boxplt> arrows(xi, mn.t - sd.t, xi, mn.t + sd.t,
boxplt+        code = 3, col = "pink", angle = 75, length = .1)

boxplt> ## boxplot on a matrix:
boxplt> mat <- cbind(Uni05 = (1:100)/21, Norm = rnorm(100),
boxplt+              `5T` = rt(100, df = 5), Gam2 = rgamma(100, shape = 2))

boxplt> boxplot(as.data.frame(mat),
boxplt+         main = "boxplot(as.data.frame(mat), main = ...)")

boxplt> par(las = 1) # all axis labels horizontal

boxplt> boxplot(as.data.frame(mat), main = "boxplot(*, horizontal = TRUE)",
boxplt+         horizontal = TRUE)

boxplt> ## Using 'at = ' and adding boxplots -- example idea by Roger Bivand :
boxplt>
boxplt> boxplot(len ~ dose, data = ToothGrowth,
boxplt+         boxwex = 0.25, at = 1:3 - 0.2,
boxplt+         subset = supp == "VC", col = "yellow",
boxplt+         main = "Guinea Pigs' Tooth Growth",
boxplt+         xlab = "Vitamin C dose mg",
boxplt+         ylab = "tooth length",
boxplt+         xlim = c(0.5, 3.5), ylim = c(0, 35), yaxs = "i")

boxplt> boxplot(len ~ dose, data = ToothGrowth, add = TRUE,
boxplt+         boxwex = 0.25, at = 1:3 + 0.2,
boxplt+         subset = supp == "OJ", col = "orange")

boxplt> legend(2, 9, c("Ascorbic acid", "Orange juice"),
boxplt+        fill = c("yellow", "orange"))

boxplt> ## more examples in  help(bxp)
boxplt>
boxplt>
boxplt>
R system commands
R Input/Output commands
R read functions
R scan function
R write function
R object creation
R matrix
R array
R data frame
R list
R user defined object
R useful functions
R expression
R arithmetic functions
R statistical functions
R functions dealing with a list
R functions
R functions dealing matrix
R other functions
R plot

R Studio
![]()
- R Studio is a Window application that composes of the standard window components.
- Control box
- Title bar
- Menu bar
- R Studio server will interact with a user via the browser software
R Studio main window
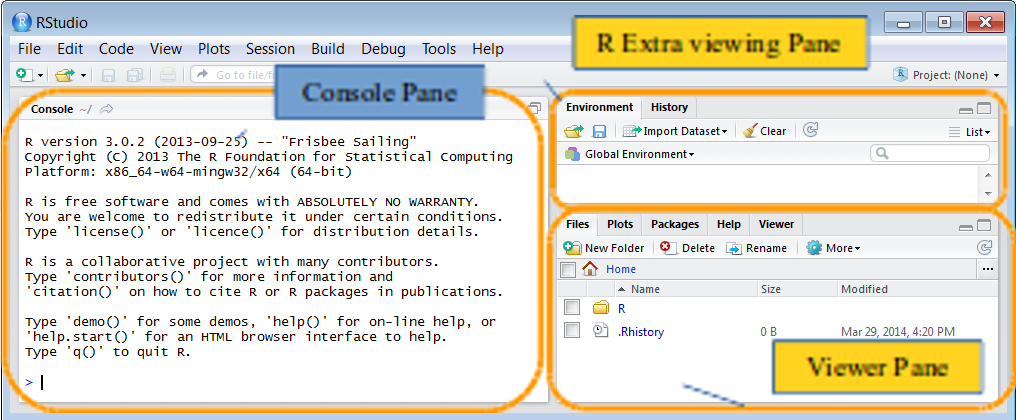
- Console Pane shows the R command box
- Viewer Pane shows Files/Plots/Packages/Help/Viewer
- Extra viewing Pane shows Environment/History/Presentation
R Studio main window
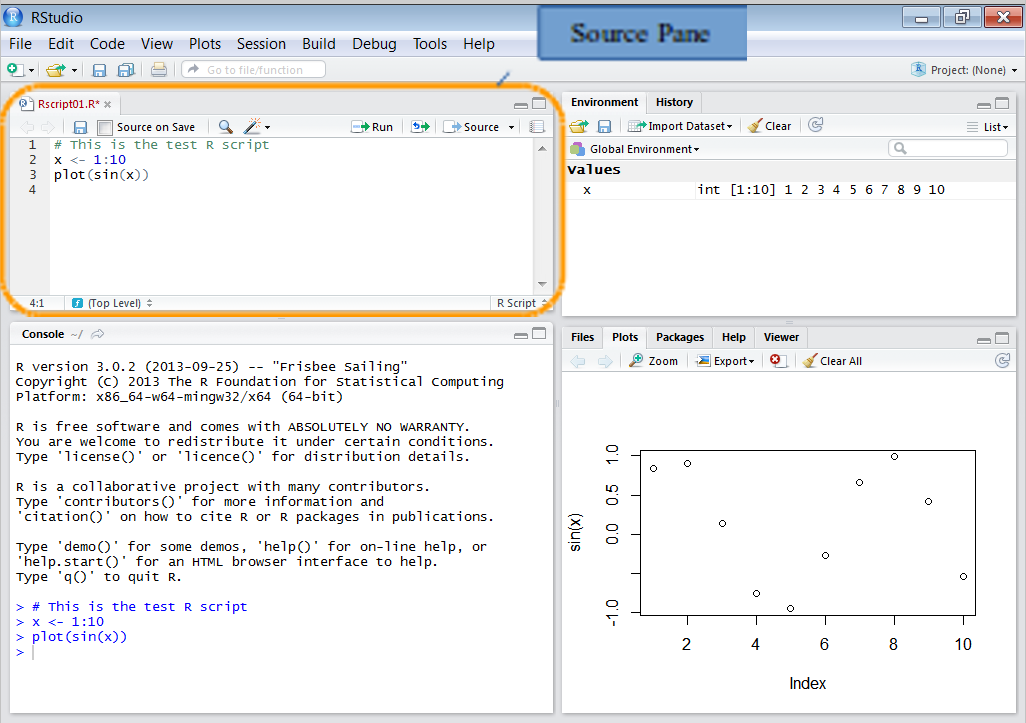
- Source Pane appears when a user selects new command.
R Studio plot sin function
plot(sin, -3*pi, 3*pi)

R Studio plot with options
plot(sin,-3*pi,3*pi,type="l",col="red",lwd=5)
title("Plot sin from -3 pi to 3 pi")

R Studio plot
y <- c(3.1, 4.2, 2.1, 3.2, 4.2, 5.1)
plot(y, type="b", col="blue", lwd=5)
title("Plot y from data")
