Surprising R
Jesse Yang
Oct 5, 2017
Review of R Basics
Annoying surprises
Too many inconsistencies
Function names toooo short
But...
Functions can be overridden
Make Sense of Factors
Quiz
Quiz - Continued
Pleasant Surprises
Factors can be used to ...
Change order of categorical variables
water %>%
  mutate(
    risk = forcats::fct_relevel(risk, 'Less Risk', 'Some Risk', 'More Risk')
  ) %>%
  group_by(risk, section) %>%
  summarise(u238=mean(uranium238)) %>%
  ggplot(aes(x=section, y=u238, fill=risk)) +
  geom_bar(stat="identity", position="dodge")

Factors can be used to ...
Convenient vector operations
Vector operations - cont.
Vector operations - cont.
Vector operations - cont.
Vector operations - cont.
Vector operations - cont.
Vector operations - cont.
Advanced vector operations
Quotes or not quotes?
Quotes or not quotes? - cont.
Quotes or not quotes? - cont.
Bonus: Debugging R scripts
Debug your R scripts
Good practices:
- Pretty-format your code. (Use Ctr/Cmd+Shift+A if you are lazy)
- Add comments to explain obscure things
- Use meaningful variable names
Debug process:
- Enable
Break in code
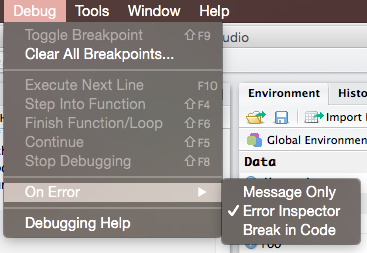
- Enable
Debug your R scripts - cont.
Bonus: Better Coding Workflow
Bonus: Better Coding Workflow
Create projects

Fold your code

“
# ======” or “# -----” both OK
Bonus: Better Coding Workflow
- Create reusable code snippets

Bonus: Better Coding Workflow

- Type
<Tab>to trigger autocomplete.