Open and Reproducible Science with R
A two day workshop in 3 hours
Mine Çetinkaya-Rundel, Duke University
Colin Rundel, Duke University
François Michonneau, University of Florida
Tracy Teal, Data Carpentry
useR!2017 – Brussels

Materials
Reproducibility crisis

Reproducibility matters
Science retracts gay marriage paper
Reproducibility matters
Seizure study retracted after authors realize data got "terribly mixed"
Reproducibility matters
Reproducibility = Accelerating science, including your own
 Bruno Oliviera
Computational research
Overcoming the training gap

Current Syllabus
Exercise: Motivating reproducibility
Part 1: Analyze + document
Part 2: Swap + discuss
Reflection
Four facets of reproducibility
Four facets of reproducibility
Documentation
Accessible documentation
Literate Programming
Provenance of copy and pasted figure:

vs. Provenance of R Markdown figure:

Data sanity checks
More formal data integrity checks
Demo
Exercise: Extending your analysis
Demo
Demo
Exercise (time permitting): More literate programming
Break
Organization
Research projects grow
Three key principles for (file) names
Exercise
Example:
Example:
Best practices for file organization
Noble, William Stafford. 2009. “A Quick Guide to Organizing Computational Biology Projects.” PLoS Computational Biology 5 (7): e1000424.
Some organizing principles for files
Automation
Write functions to automate everything
Tests made easier
Version Control
Version Control -- bad

Version Control -- OK
Version Control -- OK
Version Control -- Best
Use a version control system (e.g. git)

Why use git and GitHub?
Demo
Dissemination - Sharing, publishing, archiving
Why share / archive data & code?
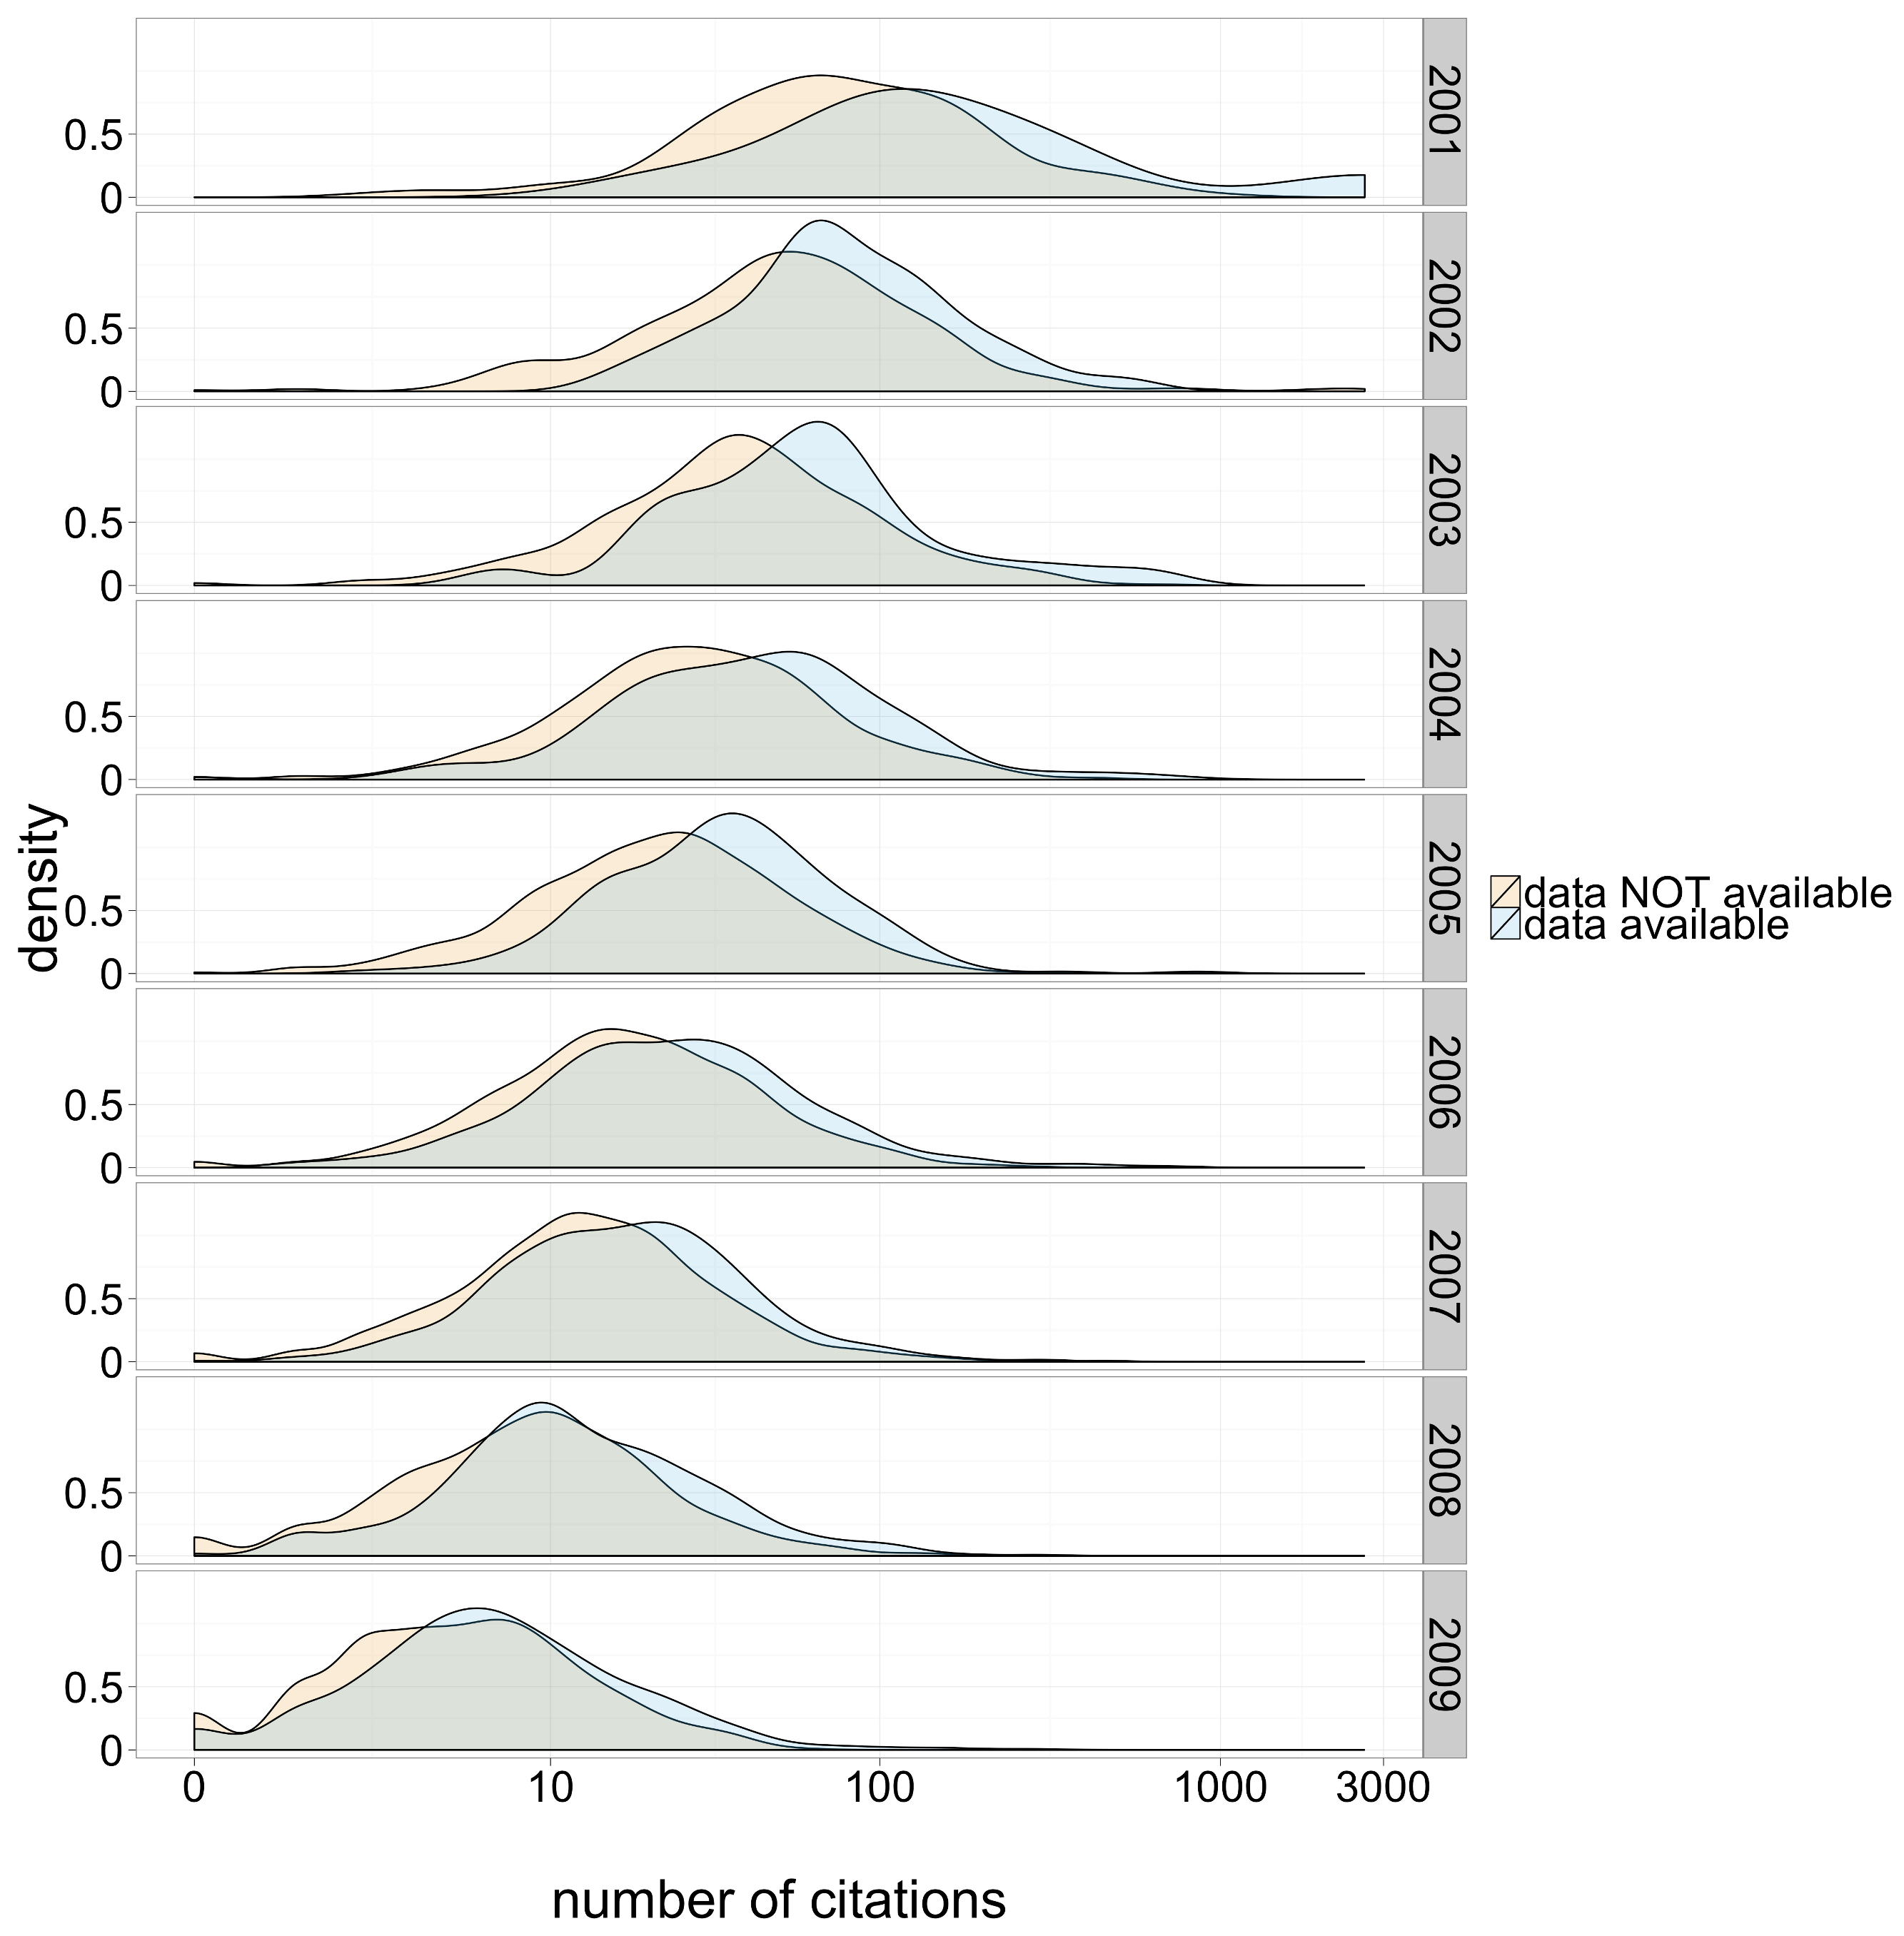
increased visibility / citation
Why share / archive data & code?
Better research
Where archive & publish?
Where archive & publish?
How to share, publish: file formats
Put a license on creative works
Software licensing guide
Don't put a license on facts (a.k.a. data)
Licenses versus community norms

From the Panton Principles:
[In] the scholarly research community the act of citation is a commonly held community norm when reusing another community member’s work. […] A well functioning community supports its members in their application of norms, whereas licences can only be enforced through court action and thus invite people to ignore them when they are confident that this is unlikely.
Good - Better - Best
 Peng, R. D. “Reproducible Research in Computational Science” Science 334, no. 6060 (2011): 1226–1227
Forming reproducible habits pays off
R packages to help you
Acknowledgements
Eating our dogfood: text formats, version control, sharing

