Econ 107 LAB session: Week2
Ran Wang
Several Important Things
Linear Regression
Data: X,Y
\[ X=(x_1,x_2,...,x_n) \] \[ Y=(y_1,y_2,...,y_n) \]

Linear Regression
Model:
\[ y=\beta_0+\beta_1x+u \]

Linear Regression
Linear Regression
Linear Regression

Linear Regression
Linear Regression
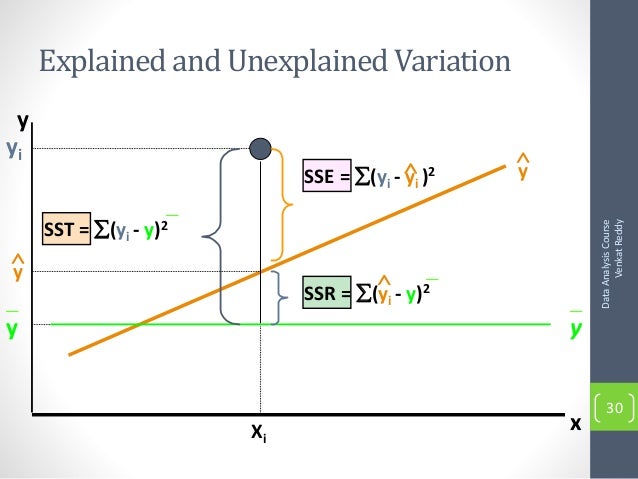
Goodness of Fit:\( R^2 \)