| Dataset Browser in Shiny | :) |
During the early stages of exploring a dataset, the ggpairs() plot is intriguing, and a clever design...
... but it's slow, and depending how much stuff you are trying to look at, the cells are too small to read.
# this is the first of two reproducible R sections in this presentation
# you have to load GGally to use the ggpairs() plot
library(GGally)
library(datasets)
ggpairs(swiss)
 |
| What about corrgram()? |
Another way to see a lot of variable relationships and a lot of correlations in a compact space is Kevin Wright's corrgram.
# this is the second reproducible section - the vote dataset is part of corrgram
library("corrgram")
corrgram(vote, order=TRUE, upper.panel=panel.cor, main="vote")

|
It's good, but also a little cumbersome and corrgram can be really slow. There's also nothing wrong with just firing plot() from the console to see things one by one, but what about a sort of dataset browser application? Like maybe written in Shiny?
| Why yes, I'm glad you asked... |
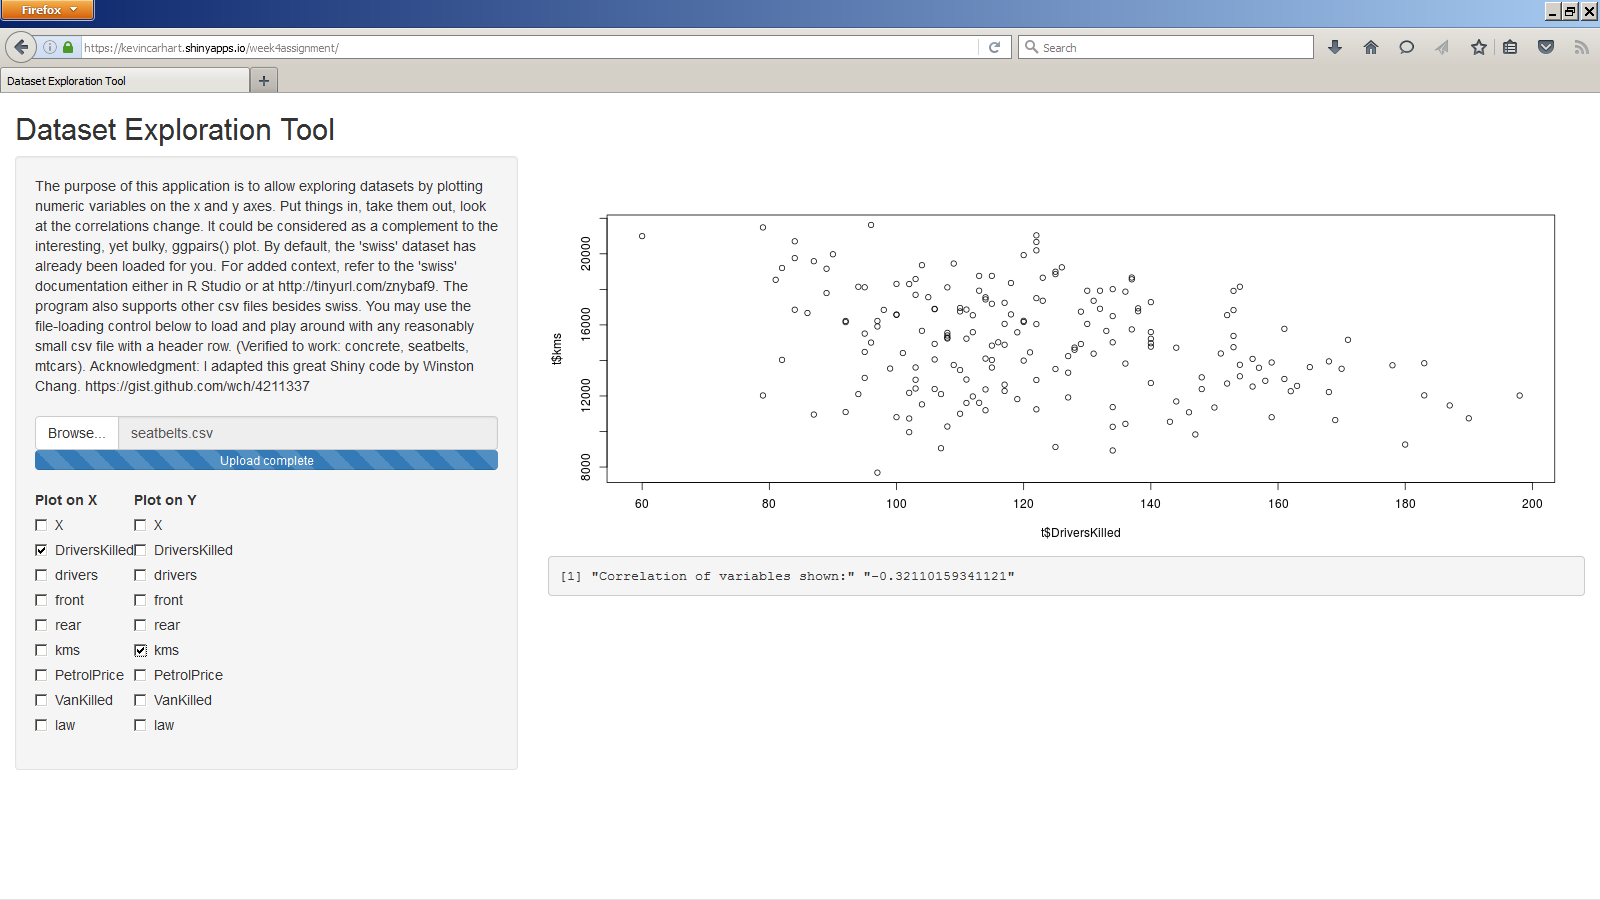
|
| I could have used this thing during the Brian classes.. |
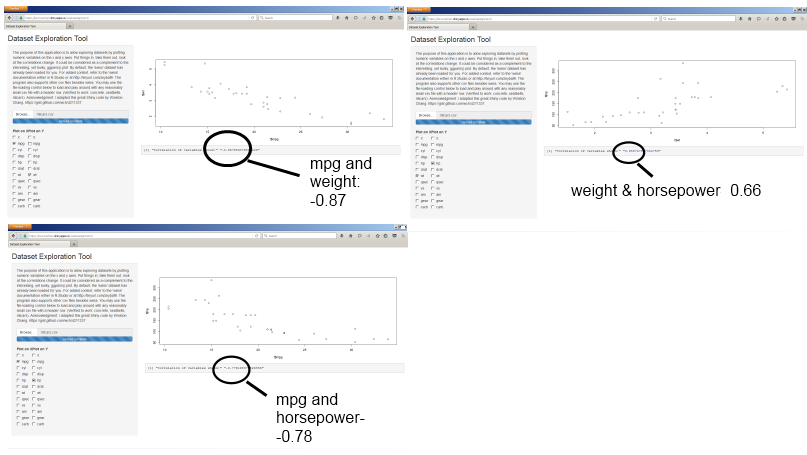
Just to take one example of how this application might be used, here's a fragment of the report I did for the multivariate-regression assignment in the Regressions class:
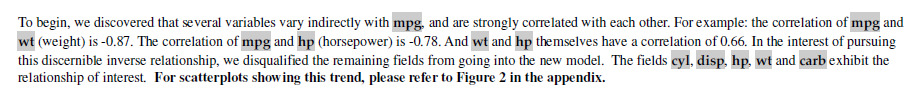
There were a lot of variable-pairs to consider. And, in the interest of parsimony, I needed to find the ones that were highly correlated amongst themselves in order to leave some out and avoid variance inflation. The question of working method is partially a matter of taste, but I probably could have saved some time if I could have discovered these things using a Shiny program.
| Exploratory analysis by visceral 'feel' |
Thank you for your attention - here are the relevant links:
(1) Application
(2) Presentation
(3) R code. "Post your code on github." I put the server and UI portions in one file.
(4) Documentation: simple documentation is given on the application itself