Lecture 5 - Regression Modeling
GEOG 4023/5023 - Quantitative Methods
Spring 2017
Carson J. Q. Farmer
carson.farmer@colorado.edu
@carsonfarmer
carsonfarmer.com
What is regression?
\( Y = b_0 + b_1x + \epsilon \)
- Used for both prediction and inference
- Probably concerned with inference in 'science'
- Models the mean of a dependent variable (\( Y \)) based on…
- Value(s) of 1 or more independent variables (\( \mathbf{X} \))
- Does \( \mathbf{X} \) affect \( Y \)? If so, in what way? How?
- What is change in \( Y \) given change in \( \mathbf{X} \)?
Regression models
- Regression models assume…
- There is a distribution of \( Y \) for each level of \( \mathbf{X} \)
- The mean of distribution depends on \( \mathbf{X} \)
- The Std Dev of distribution does not depend on \( \mathbf{X} \)
Visualizing conditional distributions

- Mean of \( Y \), conditional on \( \mathbf{X} \) \( \uparrow \)
- Std Dev of \( Y \), not conditional on \( \mathbf{X} \) \( \uparrow \)
Critical assumptions
- This simple idea…
- For each level of \( \mathbf{X} \) there is
Normaldistribution describing \( Y \)
- For each level of \( \mathbf{X} \) there is
- Homoskedasticity
- Std Dev of distribution not conditional on \( \mathbf{X} \)!
Heteroskedasticity

Heteroskedasticity

Something to remember
- Regression analysis a simplification of reality…
- Provides us with simplified view of relationship between 2 or more variables
- A way of fitting a model to our data
- Means for evaluating importance of variables to outcome of interest
- A way to assess fit of model and to compare models
\[ Y = \beta_0 + \mathbf{\beta}_1\mathbf(X) + \epsilon \\ Y_i = \beta_0 + \beta_1X_{i1} + \beta_2X_{i2} + \dots + \epsilon_i \]
“Remember that all models are wrong; the practical question is how wrong they have to be to be not useful.”
- George Box


What are the criteria for a good line through the data?
Least squares
- A good line minimizes distance between each data point and 'line'
- Means our model (currently just a line) is as close as possible to our data
- Referred to as the least squares line
- To get this line we have to…
- Estimate some parameters
- Simplest method is via ordinary least squares (OLS)
All about residuals
- Good model is one that…
- Describes data well
- Can measure how well model describes data by…
- Looking at residuals
- Models with small residuals said to fit the data
- Process of doing a regression somtimes called…
- Fitting a model to the data
All about residuals
- Regression model
- \( Y = \alpha + \beta x + \epsilon \)
- Estimate of \( Y \) conditional on \( x \)
- \( \hat{Y} = a + b x \)
- Difference between observed and estimated is residual
- \( Y_i - \hat{Y} = \text{resid} \)
Anatomy of a regression line

\[ \hat{Y} = \mathbf{a} + bx \]
Anatomy of a regression line

\[ \hat{Y} = a + \mathbf{b}x \]
Anatomy of a regression line

\[ \hat{Y}_i - \hat{Y}_i \]
Least squares
- Want to find line that minimizes residuals
- Difference between regression prediction and observed data
- Line with least square error
\[ \min_{a, b} \sum_{i=1}^n (Y_i - \hat{Y})^2 = \min_{a, b} \sum_{i=1}^n (Y_i - a + b x_i)^2 \]
Visualizing the squared residuals
- Let's visualize sum of squared errors to provide some intuition
- First, we load some useful functions and data
source("http://www.mosaic-web.org/go/datasets/mLineFit.R")
library(mosaicData)
data("KidsFeet")
- And then we visualize in RStudio
mLineFit(width ~ length, data=KidsFeet)
- If you can an error here, you might need to…
install.packages(c("manipulate", "mosaicData"))
An example
- The
Utilitiesbuilt-in dataset contains data from utility bills at a residence - Its a
data.framecontaining 117 obervations for several variablesmonth,day,year,temp,ccf(gas usage),kwh(elec. usage), etc.
- Let's model relationship between outside temperature and gas usage
- Use the
lm()function to fit a linear model
- Use the
An example
library(dplyr)
data("Utilities") # Load some builtin data
Utilities %>%
select(month, day, year, temp, ccf, kwh) %>%
summary() # Compute summary of subset of columns
month day year temp
Min. : 1.000 Min. :23.00 Min. :1999 Min. : 9.00
1st Qu.: 4.000 1st Qu.:26.00 1st Qu.:2002 1st Qu.:30.00
Median : 7.000 Median :26.00 Median :2005 Median :51.00
Mean : 6.564 Mean :26.59 Mean :2005 Mean :48.66
3rd Qu.: 9.000 3rd Qu.:28.00 3rd Qu.:2007 3rd Qu.:69.00
Max. :12.000 Max. :36.00 Max. :2010 Max. :78.00
ccf kwh
Min. : 0.00 Min. : 160
1st Qu.: 16.00 1st Qu.: 583
Median : 60.00 Median : 790
Mean : 83.44 Mean : 751
3rd Qu.:144.00 3rd Qu.: 893
Max. :242.00 Max. :1213
plot(Utilities) # Mine looks slightly different

m <- lm(ccf ~ temp, data=Utilities) # Fit a simple model
summary(m)
Call:
lm(formula = ccf ~ temp, data = Utilities)
Residuals:
Min 1Q Median 3Q Max
-93.892 -14.892 -2.963 13.075 84.725
Coefficients:
Estimate Std. Error t value Pr(>|t|)
(Intercept) 251.4872 5.2876 47.56 <2e-16 ***
temp -3.4535 0.1002 -34.48 <2e-16 ***
---
Signif. codes: 0 '***' 0.001 '**' 0.01 '*' 0.05 '.' 0.1 ' ' 1
Residual standard error: 22.19 on 115 degrees of freedom
Multiple R-squared: 0.9118, Adjusted R-squared: 0.911
F-statistic: 1189 on 1 and 115 DF, p-value: < 2.2e-16


Interpreting parameters
- In a simple regression model we have two parameters
- Slope - Expected change in \( Y \) for one unit change in \( X \)
- Intetcept - Expected for of \( Y \) when \( X \) is zero
The intercept
- Sometimes \( X \) cannot logically equal zero
- Useful to transform variable so intercept is interpretatble
- Example
- Subtracting mean from each observation so that \( X=0 \) is the mean of \( X \)
- Other transformations are sometimes useful
Changing meaning of intercept
# 'Recode' temp variable
Utilities <- mutate(Utilities, temp = temp - mean(temp))
# Refit model and get coefficients summary
summary(lm(ccf ~ temp, data=Utilities))$coefficients
Estimate Std. Error t value Pr(>|t|)
(Intercept) 83.44444 2.0512277 40.68024 4.152433e-70
temp -3.45354 0.1001587 -34.48069 1.792965e-62
Intercept and coefficient on temp
Hypothesis tests on coefficients
- Can evaluate models by looking at hypothesis tests included in output
- Understand t-test on regression coefficients
- Derive \( R^2 \) value
Hypothesis tests about coefficients
- Each regression coefficient is t-tested
- Null hypothesis for test is that coefficient is zero (\( \beta = 0 \))
\[ t = \frac{\text{observed diff} - \text{expected diff}}{\text{Std Err}} = \frac{(\hat{\beta} - 0) - 0}{\text{Std Err}} \]
- In previous slide
-3.45/0.10 = -34.5
Why do t-tests work on coefficients?
- Regression coefficients have Normal sampling distribution
- In regression, standard errors of distribution are estimated
- Estimate is used to construct t-test
- Can simulate standard error of coefficients under null hypothesis…
- Simulated results should be similar to estimate
Simulating standard errors
# This should look familiar
sigma <- matrix(c(1, 0.1, 0.1, 1), nrow=2)
mu <- c(0, 0)
# Generate multi-variate random normal data
df <- as.data.frame(mvrnorm(10000, mu, sigma))
- First, we'll plot the data
plot(V2 ~ V1, data=df)

V1 and V2
Simulating standard errors
library(mosaic)
# Run 1000 regressions on samples of 100 each
betas <- do(1000) * coef(lm(V2 ~ V1, data=sample(df, 100)))
- Plot distribution of slope (coefficient on
V1)
hist(betas$V1)

Simulating standard errors
sd(~V1, data=betas) # Print standard deviation
[1] 0.1003523
# Rerun on another sample
mod <- lm(V2 ~ V1, data=sample(df, 100))
summary(mod)$coefficients
Estimate Std. Error t value Pr(>|t|)
(Intercept) 0.07512985 0.09210434 0.8157037 0.4166478
V1 0.09385312 0.09076209 1.0340563 0.3036549
- Varition in simulated coefficients (
sd) is close to estimate of standard error of slope from regression (based on sample) lmdoes good job of estimating random variation in regression coefficients
An example
summary(lm(ccf ~ temp, data=Utilities))
- What does
Coefficientstable \( \downarrow \) tell us?
Estimate Std. Error t value Pr(>|t|)
(Intercept) 83.44444 2.0512277 40.68024 4.152433e-70
temp -3.45354 0.1001587 -34.48069 1.792965e-62
- What does
Multiple R-squared\( \downarrow \) tell us?
Residual standard error:22.19 on 115 degrees of freedom
Multiple R-squared: 0.9118, Adjusted R-squared: 0.911
F-statistic: 1189 on 1 and 115 DF, p-value: < 2.2e-16
A note about coefficients...
- Coefficients have units…
ccf = 83.444 - 3.454temp
- Required to transform to units of response/dependent variable
ccf: cubic centimeters of fuel
- So units on
temp(degrees F) coefficient…- ccf per degree F
- An the intercept is simply ccf
How much does a model 'explain'?
- Remember, regression is a model of mean \( Y \) conditional on \( \mathbf{X} \)'s
- Basic idea is that mean of \( Y \) is somehow affected by \( \mathbf{X} \)
- Change in \( \mathbf{X} \) of 1 associated with change of \( \beta \) in \( Y \)
- Need a way to tell how much of change in \( Y \) is attributable to changes in \( \mathbf{X} \)
Decomposing variability in Y
- Deviations from mean can be partially explained by covariate \( X \)
- Some fraction of deviations from mean will be due to \( X \)
- Some fraction of deviations will be unexplained by \( X \)
- Example:
girthof tree may be strongly related to itsage- Tree
girth(\( Y \)) is partially explained by treeage\( X \) - How much variability in tree
girthis explained by treeage?
- Tree
Decomposing variance in Y
- If we disregard tree
age(\( X \)) – the explanatory variable… - Could compute the variance in
girth(\( Y \))- Sum of squared deviations from mean
- That variance is not just noise…
- Some trees are thicker than others because of … {insert \( X \) or other explanatory variable}…
Relating total variance
- If we add up…
- Squared difference between model predictions (\( \hat{Y} \)) and mean (\( \bar{Y} \))
- The squared residuals (\( Y_i - \hat{Y} \))
- Should get the total squared deviations from the mean
Decomposing variability in Y
\[ \color{red}{ \sum_{i=1}^n (Y_i - \bar{Y}_i)^2 } = \color{green}{ \sum_{i=1}^n (\hat{Y}_i - \bar{Y}_i)^2 } + \color{blue}{ \sum_{i=1}^n (Y_i - \hat{Y}_i)^2 } \]
- Total sum of squares (TSS)
- Regression (explained) sum of squares (ESS)
- Residual sum of squares (RSS)
\[ R^2 = \frac{ \color{green}{ \sum_{i=1}^n (\hat{Y}_i - \bar{Y}_i)^2} }{\color{red}{\sum_{i=1}^n (Y_i - \bar{Y}_i)^2} } \]
- Proportion of total explained variation in \( Y \) is called coefficient of determination
Coefficient of determination
- Percent of the total sum of squares explained by regression
\[ R^2 = \frac{\text{regression}_{ss}}{\text{total}_{ss}} = \frac{\sum_{i=1}^n (\hat{Y}_i - \bar{Y}_i)^2}{\sum_{i=1}^n (Y_i - \bar{Y}_i)^2} \]
Coefficient of determination
- \( R^2 \) of 0.63 indicates variable(s) in model explain 63% of variation in response/outcome/dependent variable
- Large \( R^2 \) does not necessarily imply a 'good' model
- \( R^2 \) does not…
- Measure magnitude of slope
- Measure appropriateness of model
- As predictors are added to model, \( R^2 \) must increase
- Adjusted-\( R^2 \) 'controls' for number of predictors in model (so does F-statistic)
- Generally, you should report Adjusted-\( R^2 \)
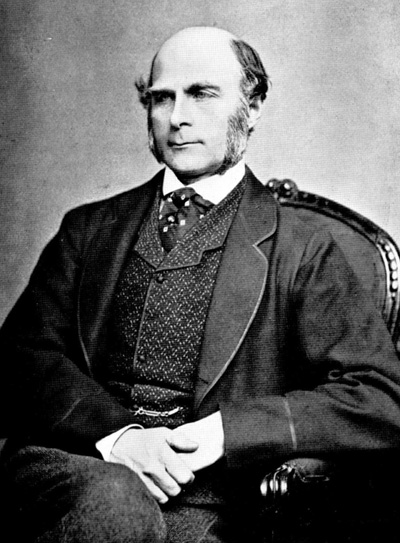
Sir Francis Galton -- 1888!
Compute and compare R-squared
- Captures over half the variance in response
- \( R^2 \) = 7.21 in\( ^2 \) / 12.84 in\( ^2 \) = 0.56 (no units)
- Ratio of variances
- Can compare any combination of models
- Fraction of variance in response account for my model…
wage ~ sex*married: \( R^2 \) = 0.07ccf ~ temp: \( R^2 \) = 0.91
- Compute \( R^2 \) in
R?summary()on the model
Ratios
- Why not, say
var(fitted)/var(resid)? - That we be reasonable too…
var(fitted)/var(response)has nice property of being easy to interpret- Always between 0 and 1
- More technical statistic, F-statistic
\[
F = \frac{\frac{\text{Var(fitted)}}{m-1}}{\frac{\text{Var(resid)}}{n-m-1}}
\]
- Nice properties in terms of shape of probability distribution
- Fundamentally no advantage over \( R^2 \)
How big is big enough?
- Depends on purpose
- \( R^2 \) = 0.01 on daily stock-market prices…
- Plenty to become richest person around!
- General 'consensus'…
- Bigger than 0.15… probably more like > 0.45
- Better to consider F-statistic and its p-value
A note about residuals
- Unless \( R^2 \) is 100%…
- Will always be some amount of variation in \( Y \) which remains unexplained by \( \mathbf{X} \)
- Unexplained variation is the error (\( \epsilon \)) component of the regression equation
Signal and noise
Can think of a regression model as having two parts:
- Predicts average of \( Y \) for given value/combination of \( \mathbf{X} \)
- Random error!
Expected value of error is zero (\( \text{E}(\epsilon) = 0 \))
- Assume a Normal distribution with independent errors (iid)
The model is an estimate
- Don't know the truth…
- Only estimates based on data
- Confidence intervals for parameters
- Since model parameters (slope and intercept) are estimated… *Prediction should account for this uncertainty
Intervals for parameters
# Using WHO dataset again...
url <- "https://www.dropbox.com/s/l0j6wjue5armi4q/WHO.csv?dl=1"
who <- read.csv(url)
# Fitting simple model
mod <- lm(IMR ~ log(GNI), data=who)
confint(mod)
2.5 % 97.5 %
(Intercept) 212.91745 260.11324
log(GNI) -25.65125 -20.24836
- Confidence intervals \( \uparrow \) for the regression coefficients
Prediction
new <- data.frame(GNI = c(6.5, 7.5, 8, 9))
predict(mod, newdata = new, interval = 'confidence')
fit lwr upr
1 193.5579 174.9470 212.1687
2 190.2737 172.0426 208.5048
3 188.7926 170.7326 206.8526
4 186.0895 168.3417 203.8373
plot(mod) # Plot standard diagnostic plots

- Violating assumptions?
- Looks like \( \uparrow \) we have some outliers?

- Histograms and residuals…
Next time on, Quantitative Methods...
- Multiple regression and model diagnostics
- Generalized linear models (GLMs)
- Logistic and Poisson regression
- Modeling spatial data!