Binary Classifiers
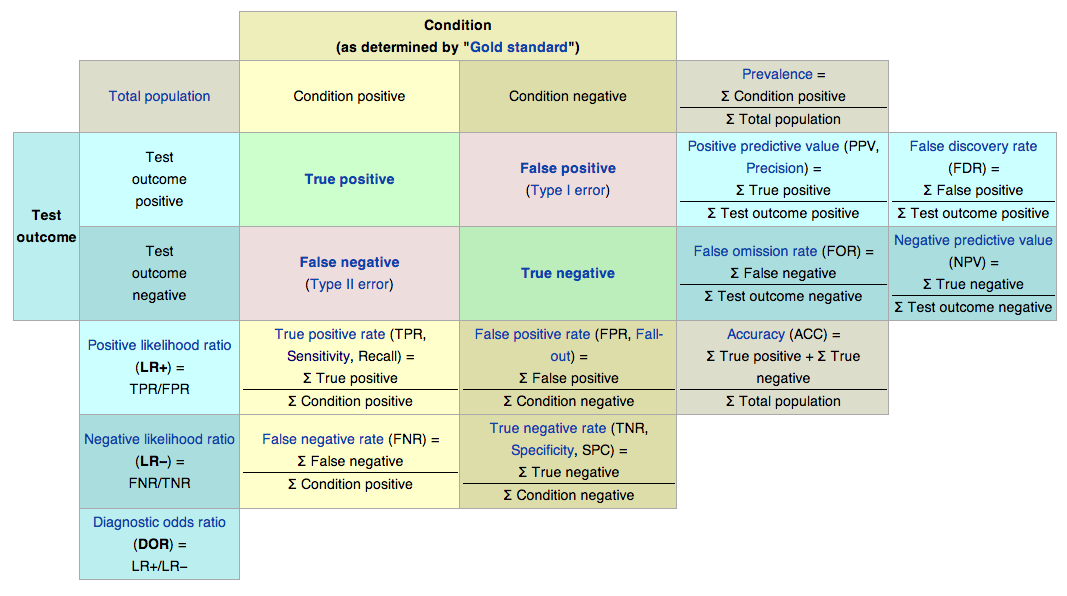
- A common task with binary classifier models is to assess its performance using a tool known a Confusion Table or Confusion Matrix
- Statistics measure different aspects of classification performance
Niels Hanson
Graduate Student
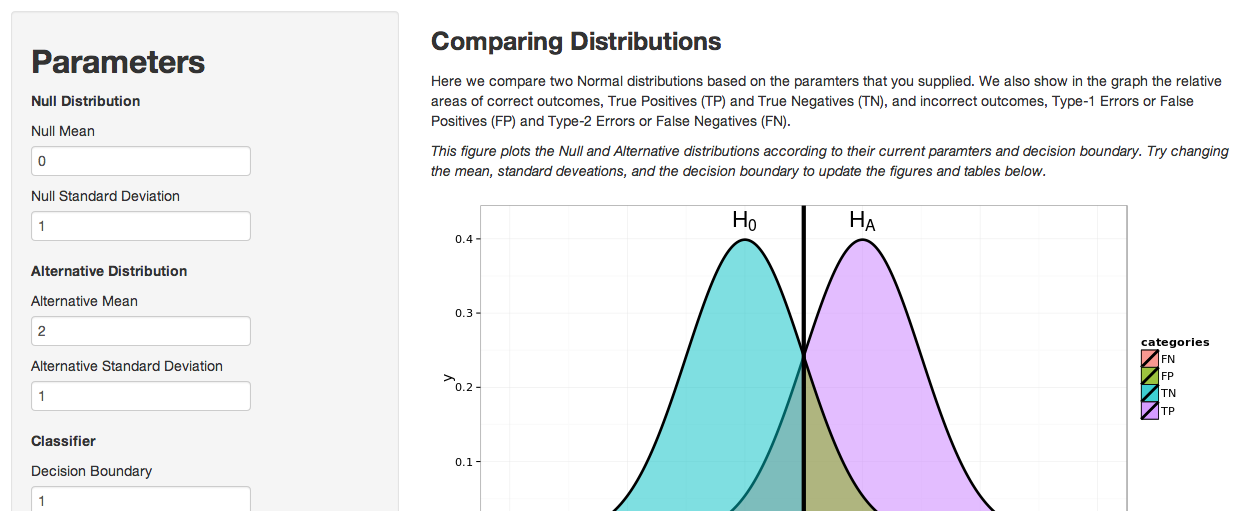
xvals <- seq(-3, 6, length = 1000)
y1 <- dnorm(xvals, mean = 0, sd = 1)
y2 <- dnorm(xvals, mean = 2, sd = 1)
df <- data.frame(x=c(xvals,xvals),
                 y=c(y1,y2),
                 hypothesis=c(rep("H_0", length(y1)), rep("H_A", length(y2))))
lin <- 1.2 # decision boundary
library(ggplot2)
ggplot(df, aes(x,y, group=hypothesis)) +
           geom_ribbon(data=subset(df,x>lin & x<max(x) & hypothesis=="H_0"),aes(x=x, ymax=y, ymin=0, fill="False Positive")) +
           geom_ribbon(data=subset(df,x<lin & x>min(x) & hypothesis=="H_A"),aes(x=x, ymax=y, ymin=0, fill="False Negative")) +
           geom_line(size=1) +
           geom_vline(xintercept = lin, size=1.5, color="black") + theme_bw()