R for Everything: Getting, Cleaning, Visualizing, and Analyzing Data
David Ranzolin
November 17, 2016
About Me

About UC Scout


Valid Inferences?
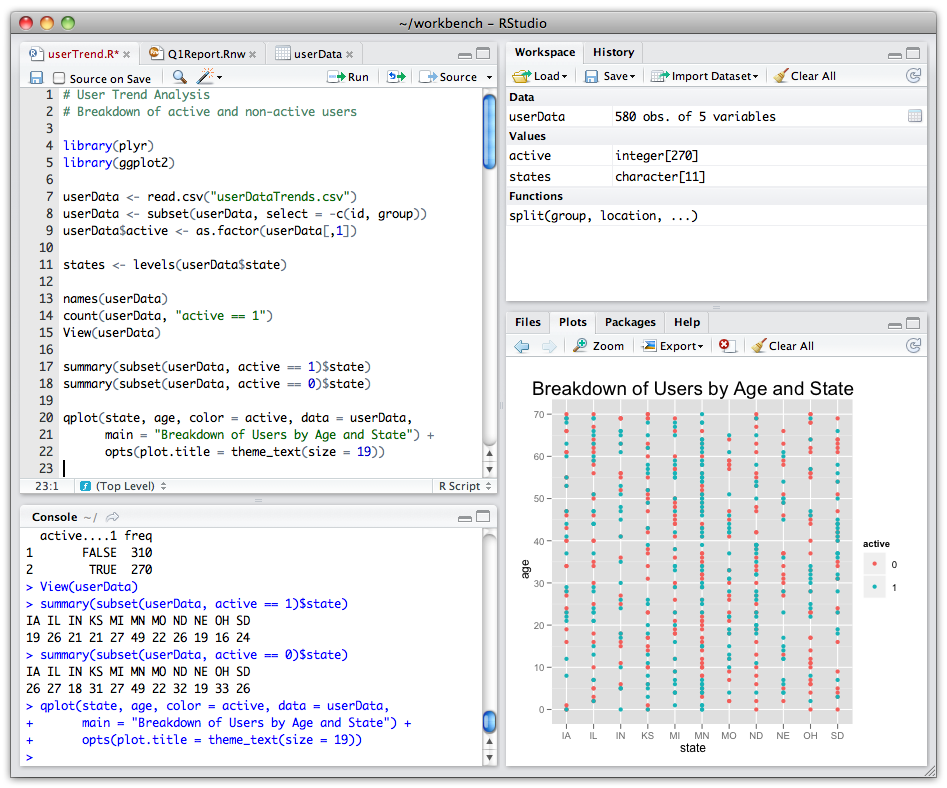
About R
![]()
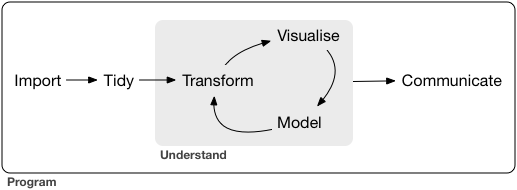
The tidyverse
Philosophy
- Data should be in a consistent form (data frame)
- Each variable is a column
- Sequence clear, logical steps
Installation
install.packages("tidyverse")
library(tidyverse) #loads readr, dplyr, tidyr, purrr, ggplot2, tibble
The tidyverse: readr
The tidyverse: dplyr
The tidyverse: dplyr
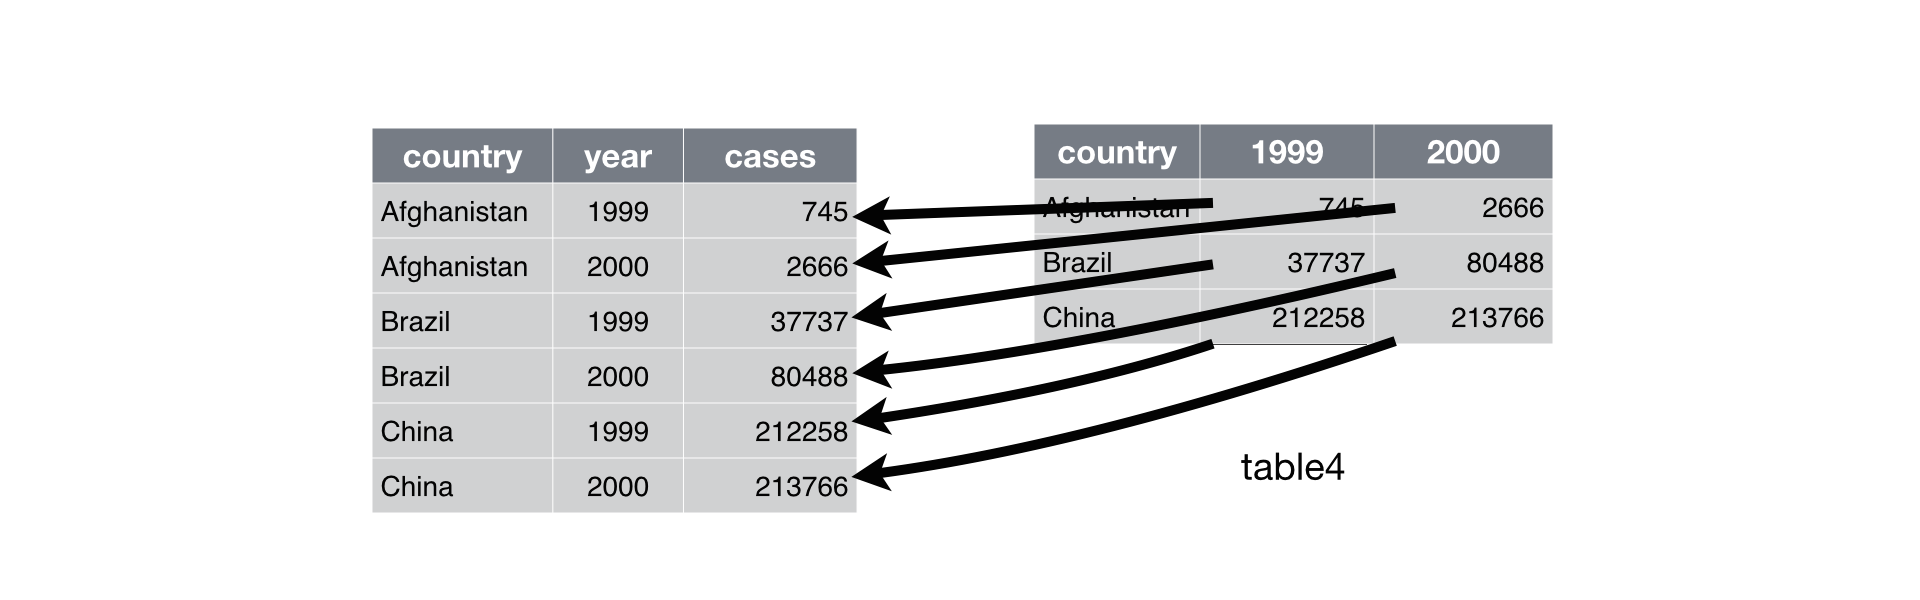
The tidyverse: tidyr
Purpose
Package to tidy and reshape data.
Usage
| To… | Use… |
|---|---|
| Make wide data long | gather() |
| Make long data wide | spread() |
table4 %>% gather(year, cases, -country)
The tidyverse: purrr
The tidyverse: purrr
The tidyverse: ggplot2
