Eurostat (regional) maps using R and eurostat-package
Markus Kainu
Generated: 2016-09-19 15:49:22
The maps below are just quick and dirty examples of how you can reproduce the maps displayed in Eurostat regional yearbook using R and the latest version (2.2.1) of eurostat-package.
You can reproduce the examples by
- Installing R
- installing the required packages in your R
- copy-pasting & executing the source code chunks above each map in your R
Copy, tweak, share and enjoy!
1 Population projections
Inspired by Eurostat map http://ec.europa.eu/eurostat/statistics-explained/images/f/f8/Projected_percentage_change_of_the_population%2C_by_NUTS_3_regions%2C_2015%E2%80%9350_%28%C2%B9%29_%28%25%29_RYB2016.png
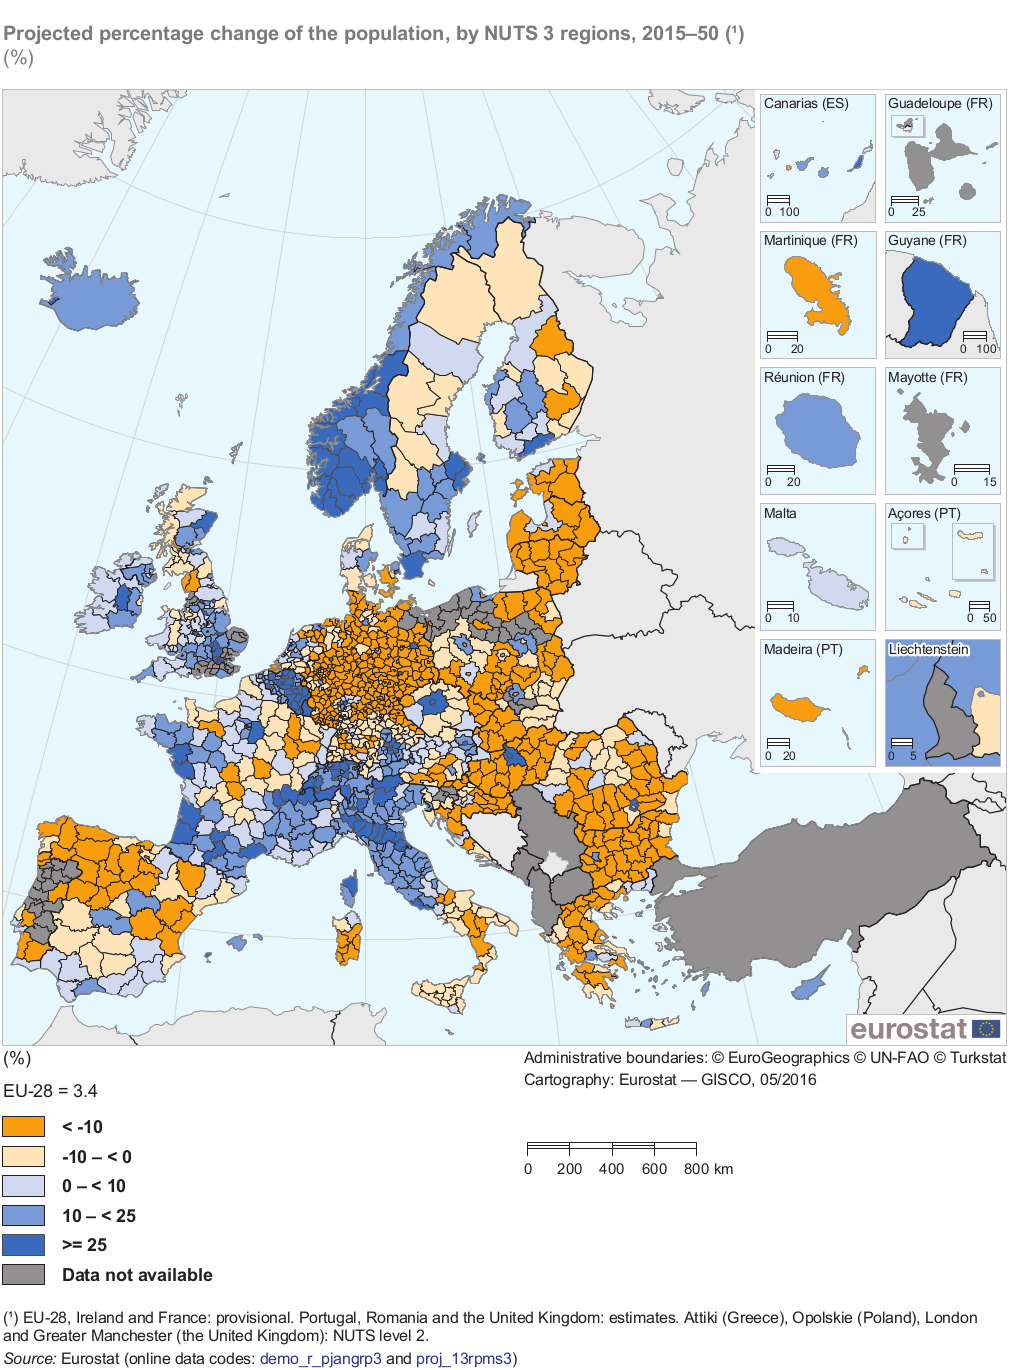
library(eurostat)
library(dplyr)
library(ggplot2)
library(stringr)
# Data from Eurostat
current_pop <- get_eurostat("demo_r_pjangrp3", time_format = "raw", stringsAsFactors = FALSE) %>%
  filter(time == 2015,
         nchar(geo) == 4,
         sex == "T",
         age == "TOTAL") %>%
  select(-unit) %>%
  rename(current = values,
         time_current = time)
projected_pop <- get_eurostat("proj_13rpms3", time_format = "raw", stringsAsFactors = FALSE) %>%
  filter(time == 2050,
         nchar(as.character(geo)) == 4,
         sex == "T",
         age == "TOTAL") %>%
  rename(projected = values,
         time_projected = time)

left_join(current_pop,projected_pop) %>%
  mutate(change = projected / current * 100 -100) %>%
    dplyr::mutate(cat = cut_to_classes(change, manual = TRUE, manual_breaks = c(-50,-10,0,10,25,130))) %>%
  # dplyr::mutate(cat = cut_to_classes(change)) %>%
  # merge with geodata
  merge_eurostat_geodata(data=.,geocolumn="geo",resolution = "20", output_class = "df", all_regions = FALSE) %>%
  # plot map
  ggplot(data=., aes(x=long,y=lat,group=group)) +
  geom_polygon(aes(fill=cat),color="dim grey", size=.1) +
  scale_fill_manual(values = c("dim grey","#d7191c","#fdae61","#ffffbf","#a6d96a","#1a9641")) +
  # scale_fill_continuous(trans = 'reverse', ) +
  guides(fill = guide_legend(reverse=T, title = "%")) +
  labs(title="Projected percentage change of the population, by NUTS2 regions, 2015-2050 (%)",
       subtitle="%",
       caption="(C) EuroGeographics for the administrative boundaries
                Map produced in R with a help from Eurostat-package <github.com/ropengov/eurostat/>") +
  theme_light() + theme(legend.position=c(.8,.8), text=element_text(family="opensans")) +
  coord_map(project="orthographic", xlim=c(-12,44), ylim=c(35,70))
2 Fertility rate
Inspired by Eurostat map http://ec.europa.eu/eurostat/statistics-explained/images/b/b0/Total_fertility_rate%2C_by_NUTS_3_regions%2C_2014_%28%C2%B9%29_%28average_number_of_live_births_per_woman%29_RYB2016.png
library(eurostat)
library(dplyr)
library(ggplot2)
library(stringr)
fer <- search_eurostat("fertility")

# Data from Eurostat
get_eurostat("demo_r_frate3", time_format = "raw", stringsAsFactors = FALSE)  %>%
  # we need a country var for reproducing the Eurostat map
  # # categorise
   dplyr::mutate(cat = cut_to_classes(values, n=7, decimals = 1)) %>%
  # merge with geodata
  merge_eurostat_geodata(data=.,geocolumn="geo",resolution = "20", output_class = "df", all_regions = FALSE) %>%
  # plot map
  ggplot(data=., aes(x=long,y=lat,group=group)) +
  geom_polygon(aes(fill=cat),color="dim grey", size=.1) +
  scale_fill_manual(values = c("#d73027","#fc8d59","#fee08b","#ffffbf","#d9ef8b","#91cf60","#1a9850")) +
  # scale_fill_continuous(trans = 'reverse', ) +
  guides(fill = guide_legend(reverse=T, title = "Total fertility rate (%)")) +
  labs(title="Total fertility rate, by NUTS-3 regions, 2014",
       subtitle="Average number of live births per woman",
       caption="(C) EuroGeographics for the administrative boundaries
                Map produced in R with a help from Eurostat-package <github.com/ropengov/eurostat/>") +
  theme_light() + theme(legend.position=c(.8,.8), text=element_text(family="opensans")) +
  coord_map(project="orthographic", xlim=c(-12,44), ylim=c(35,70))
3 Employment
Inspired by Eurostat map http://ec.europa.eu/eurostat/statistics-explained/images/0/07/Employment_rate%2C_persons_aged_20%E2%80%9364%2C_by_NUTS_2_regions%2C_2015_%28%25%29_RYB2016.png
library(eurostat)
library(dplyr)
library(ggplot2)
library(stringr)
unemp <- search_eurostat("unemployment")

# Data from Eurostat
get_eurostat("lfst_r_lfe2emprt", time_format = "raw", stringsAsFactors = FALSE)  %>%
  filter(age %in% "Y20-64",
         sex %in% "T",
         nchar(geo) == 4,
         time == 2015) %>%
  # we need a country var for reproducing the Eurostat map
  # # categorise
   dplyr::mutate(cat = cut_to_classes(values, n=7, decimals = 1)) %>%
  # merge with geodata
  merge_eurostat_geodata(data=.,geocolumn="geo",resolution = "20", output_class = "df", all_regions = FALSE) %>%
  # plot map
  ggplot(data=., aes(x=long,y=lat,group=group)) +
  geom_polygon(aes(fill=cat),color="dim grey", size=.1) +
  scale_fill_manual(values = c("#d73027","#fc8d59","#fee08b","#ffffbf","#d9ef8b","#91cf60","#1a9850")) +
  # scale_fill_continuous(trans = 'reverse', ) +
  guides(fill = guide_legend(reverse=T, title = "Employment rate (%)")) +
  labs(title="Employment rate, persons aged 20-64, by NUTS 2 regions, 2015",
       subtitle="%",
       caption="(C) EuroGeographics for the administrative boundaries
                Map produced in R with a help from Eurostat-package <github.com/ropengov/eurostat/>") +
  theme_light() + theme(legend.position=c(.8,.8), text=element_text(family="opensans")) +
  coord_map(project="orthographic", xlim=c(-12,44), ylim=c(35,70))
4 Sessioninfo
sessionInfo()## R version 3.3.1 (2016-06-21)
## Platform: x86_64-pc-linux-gnu (64-bit)
## Running under: Linux Mint 18
##
## locale:
## [1] LC_CTYPE=fi_FI.UTF-8 LC_NUMERIC=C
## [3] LC_TIME=fi_FI.UTF-8 LC_COLLATE=fi_FI.UTF-8
## [5] LC_MONETARY=fi_FI.UTF-8 LC_MESSAGES=fi_FI.UTF-8
## [7] LC_PAPER=fi_FI.UTF-8 LC_NAME=C
## [9] LC_ADDRESS=C LC_TELEPHONE=C
## [11] LC_MEASUREMENT=fi_FI.UTF-8 LC_IDENTIFICATION=C
##
## attached base packages:
## [1] stats graphics grDevices utils datasets methods base
##
## other attached packages:
## [1] stringr_1.1.0 ggplot2_2.1.0.9000 dplyr_0.5.0
## [4] eurostat_2.2.20001 knitr_1.14
##
## loaded via a namespace (and not attached):
## [1] Rcpp_0.12.7 magrittr_1.5 maps_3.1.1
## [4] munsell_0.4.3 colorspace_1.2-6 lattice_0.20-34
## [7] R6_2.1.3 plyr_1.8.4 httr_1.2.1
## [10] tools_3.3.1 grid_3.3.1 gtable_0.2.0
## [13] DBI_0.5-1 e1071_1.6-7 htmltools_0.3.5
## [16] class_7.3-14 lazyeval_0.2.0 yaml_2.1.13
## [19] assertthat_0.1 digest_0.6.10 tibble_1.2
## [22] mapproj_1.2-4 readr_1.0.0 RColorBrewer_1.1-2
## [25] formatR_1.4 tidyr_0.6.0 codetools_0.2-14
## [28] evaluate_0.9 rmarkdown_1.0.9009 labeling_0.3
## [31] sp_1.2-3 stringi_1.1.1 scales_0.4.0
## [34] classInt_0.1-23 jsonlite_1.1
This work is licensed under a Creative Commons Attribution 4.0 International License.