ENG403 Assignment 2
Dr Helen Fairweather
30 August, 2016
Introduction
In this assignment you will work in groups of four. You will need to include each group member’s names at the top of each report.
Each group is tasked with analysing rainfall from the Brisbane (Mt Stapylton, 128km coverage) Radar (IDR663) during the storm that occurred over the period from 2:00 AM on the 30th April 2015 through to 7:30 PM on the 1st May 2015.
Analysis of the Brisbane Radar has previously been conducted by the Bureau of Meteorology. This analysis resulted in approximate rainfall intensities being assigned to each of the 15 colours observed on the radar (Figure 1).

Figure 1: Approximate Rainfall Intensities corresponding to each radar colour from BoM Mt Staplyton Radar.
Using The Weather Chaser Radar Archives, 293 radar images were downloaded for the rainfall event that began on Wed, 29 Apr 2015 18:06:00 GMT (Wed, 30 Apr 2015 4:06:00 AM local time) and ended on Fri, 01 May 2015 07:00:00 GMT (Fri, 01 May 2015 5:00:00 PM local time). The colour pixels in each of these images were converted to a rainfall intensity by comparing to Figure 1.
The cumulative rainfall totals obtained from this comparison are shown in Figure 2.

Figure 2: Cumulative Rainfall totals for late April, early May, obtained from calibration with BoM radar rainfall intensities (legend is in mm).
The names of all the images used in this analyses and the corresponding dates and times are contained in this file
The csv files containing the rainfall amount estimated for each time step have been zipped to this file
The following steps can be carried out in Excel or R. You should include the radar background image as background to your charts. This can be downloaded from the Brisbane (Mt Stapylton, 128km coverage) Radar (IDR663)
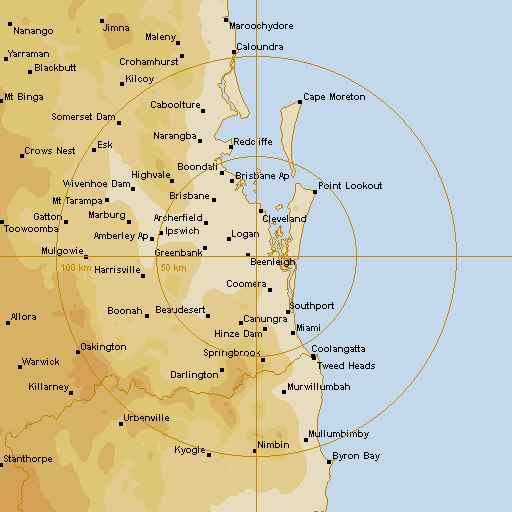
Steps
Find the coordinates of the top and bottom Latitudes and Longitudes for the Brisbane (Mt Stapylton, 128km coverage) Radar (IDR663).
Find the dimensions of the radar image using the
dimcommand in R, or count the rows and columns in one of the csv files for each time step.Plot the location of the Pluvio Graph that will be used to calibrate the radar image (
1420P001 - Mount Mee Standalone Pluvio Lat:-27.094769 Long:152.712598) by translating the Latitude and Longitude onto the corresponding point on the image. In r, use xlim and ylim arguments that align with the dimensions of the radar image found at step 2, or in excel create a chart and embed the background image into the plot area.Download Mt Mee pluvio data for the same time period, which can be obtained from Queensland Government Water Monitoring Portal.
Compare the rainfall data from the pluviograph with the time series of rainfall amounts from the corresponding point in each of the rainfall files (ie. the csv files for each time step).
Create a total rainfall plot by summing each corresponding point in each of the csv files.
Obtain as many rainfall totals from the Bureau of Meteorology daily rainfall amounts for the time period in the area of interest and compare with the totals (for the corresponding time periods) from the totals you have calculated. Note: The totals obtained in step 6 may have to be adjusted to account for the 9AM to 9AM readings that are the BoM daily totals.
Write a report on the steps you took to create the total rainfall map and the comparisons you made with other rainfall data. Comment on why you think there may be discrepancies.
Assessment Criteria
| Criteria | Weighting |
|---|---|
| A clear description of the methods implemented for each step | 40% |
| Reasons for error and uncertainty in the data are identified | 30% |
| Graphics are clear and labelled | 20% |
| Standard of report with appropriate referencing | 10% |