Cycling and transport policy: embedding active travel in every stage of the planning process

Robin Lovelace, University of Leeds. Slides: rpubs. Audio: spreaker.

Hackney Cycling Conference, 2016-06-10, London, UK.

Structure of the talk

  • Cycling in context
  • Comments on transport planning
  • Opportunities for embedding walking and cycling

Cycling in context

The global context

Source: WHO

Global oil supply consumed by transport

Source: iea.org

  • Transport accounts for just under 1/3rd (27%) of overall energy use

Transport energy use by mode

Source: worldenergy.org

  • But over 2/3rds of oil production!
  • hard to decarbonise

Data on travel patterns over time

Source: BHPS

  • Can lead to perception that travel patterns are stagnant

Shifting transport patterns

The long view

  • When scales are exentended it's clear travel patterns change

Trip rates since the 1970s

Source: NTS

  • There may be less demand than expected for roads, freeing up resources

Trip rates since 1995

Source: Crawford and Lovelace (2015)

  • Less dramatic but still visible with extended Y axis

The overall external costs of transport

Source: Cabinet Office, 2009

The place of cycling

Source: Sean Fitzsimons

  • First photo of cycling in London - deliberately not chosen somewhere like Blackfriars bridge becuase there is still lots to be done

The impact of cycling in context dependent

Source: Fishman et al. (2014)

City Bike trips/per day Replacement ratio Reduction in car use per bike
Melbourne 0.6 5.3 193
Brisbane 0.3 4.8 79
Washington, D.C. 3.0 14.3 247
Minnesota 0.9 5.3 135
London 3.1 50.0 79
  • The impacts of cycling policy depend on context and policies

The importance of the 'replacement ratio'

  • The replacement ratio is "the number of additional bicycle trips required to replace or prevent a single car trip" (R. Lovelace et al. 2011):

RR=ΔTripsCycledΔTripsDriven

Transport planning

Origins of Transport planning

Credit: Crispin Cooper

Institutionalised priorities

Note: TfL's front page has a chairlift going through the centre!

Institutional structures I: Board

Source: Department for Transport

Institutional structures II: Roads Traffic and Local Group

Institutional structures III: Local Transport

  • How would it look in London? Fortunately different - TfL has a different institutional culture and structure to match

Institutional structures IV

Tools for transport planning I

Source: Pixton.com

  • Are black boxes

Tools for transport planning II

Source: openclipart

  • Tools are blunt

Tools for transport planning III

Source: By James Albert Bonsack (1859 – 1924), Wikimedia

  • Are sometimes too complex!
  • This has implications for others

Embedding active modes in transport planning

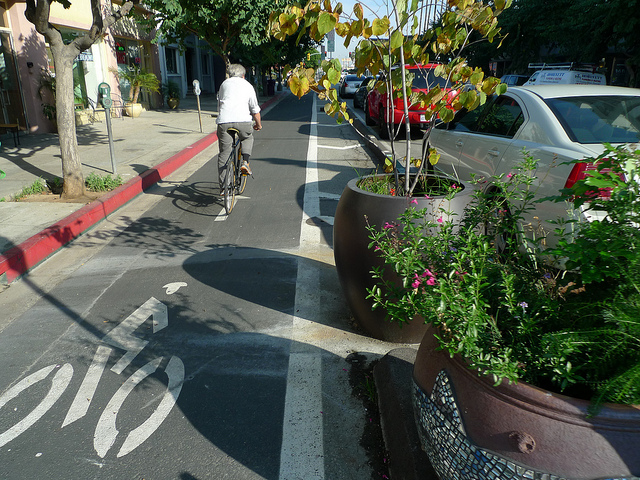
My current cycle path in the UK is currently…

Why?

  • Experimental: shows willingness to try things out

  • Cost effective: only £5 per metre

  • Clearly linked with other travel modes: 'stick and carrot'

  • Appeals to all types of cyclists and fits all types of pedal cycles
Using evidence effectively

Source: Camcycle.org

Simple innovations

Source: Central London, this morning!

Experiementation

  • Also integrating into road maintenance plans

Participatory planning

Envisioning shifting travel patterns

Source: Leeds Cycling Campaign

Institutional recognition

  • CIHT guidance on Planning for Cycling (Gallagher et al. 2014)
  • Cycling officers
  • Design guidance from Highways for England

Example: the Strategic Road Network

New digital technologies

A definition of Propensity to Cycle and its uses

Propensity to cycle refers to the modelled uptake of cycling at area, desire line and route network levels under different scenarios of the future. Policy relevant scenarios include meeting national or local targets, the potential uptake if people in the study area cycled as much as the Dutch do or the impact of electric bikes on people's willingness to cycle longer distances. (see Get Britain Cycling article, 2016)

The tool aims to help prioritise where interventions are most needed based on where cyclable trips are most common

Live demo of the PCT

Source: Robin Lovelace et al. (2016)

A predict and provide paradigm for active travel?

References

Lovelace, Robin. 2016. "Mapping out the future of cycling." Get Britain Cycling, 2016. P. 22 - 24. Available from getbritaincycling.net

Gallagher, R., J. Parkin, R. Gallagher, and J. Parkin. 2014. “Planning for Cycling.” Report or Working Paper. http://www.ciht.org.uk/en/media-centre/news/index.cfm/ciht-launches-new-planning-for-cycling-guidelines.

Lovelace, R., S.B.M. Beck, M. Watson, and A. Wild. 2011. “Assessing the Energy Implications of Replacing Car Trips with Bicycle Trips in Sheffield, UK.” Energy Policy 39 (4): 2075–87. doi:10.1016/j.enpol.2011.01.051.

Lovelace, Robin, Anna Goodman, Rachel Aldred, Nikolai Berkoff, Ali Abbas, and James Woodcock. 2016. “The Propensity to Cycle Tool: An Open Source Online System for Sustainable Transport Planning.” ArXiv:1509.04425 [Cs]. http://arxiv.org/abs/1509.04425.