Race Against Time
Gurpreet Singh
May 13, 2016
Fire Department Response Times
Research Questions
Data Collection
Analysis
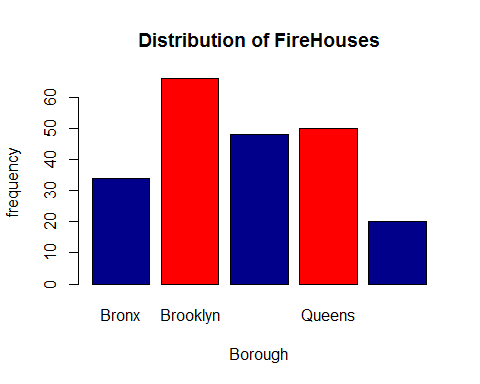
- The location dataset was converted into a frequency table providing count of the fire houses in boroughs
After performing required data manipulation the output of the location dataset and area of counties
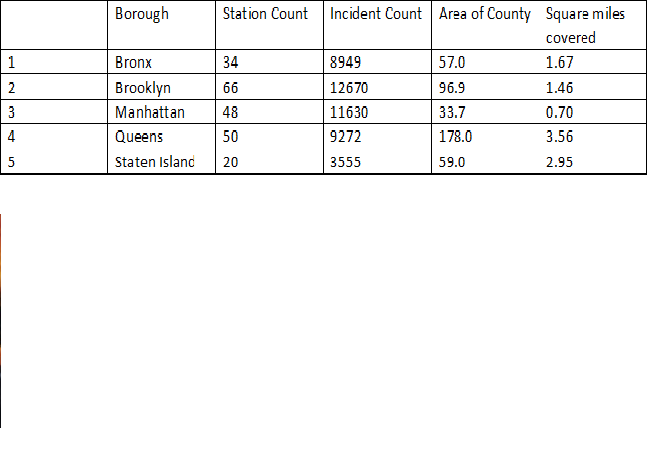 The locations were unevenly distributed and area covered by each unit varied a lot in each borough.
Chi square test was performed to check the dependence of incident count on response times which did not provide strong evidence for dependence of response times on incident counts
Corelation coefficient was calculated to determine the if there were some factors affecting response time, station count was negatively corelated to response time with a coffecient of -0.79. that is if one increase other should decrease.
Visualization
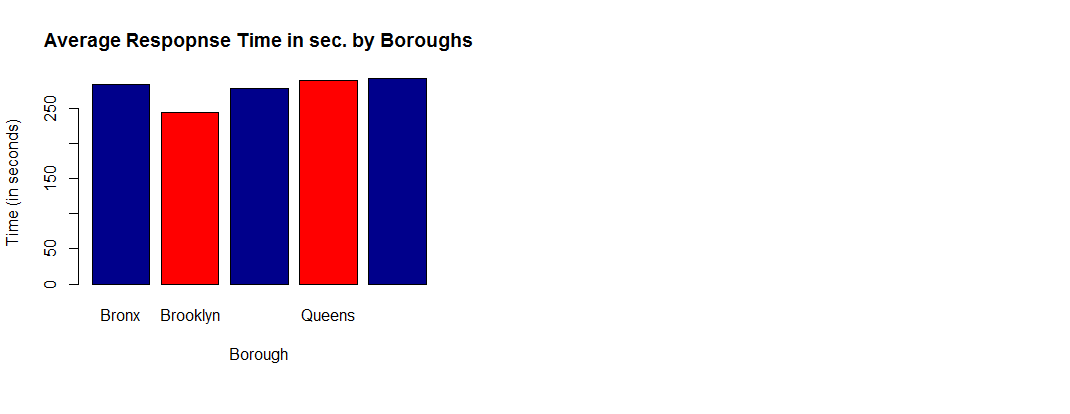
Mean Time for three zones
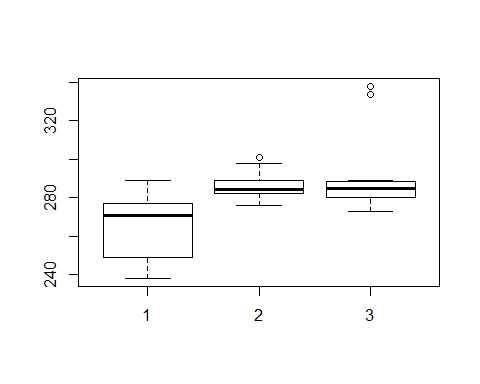
1 = High Risk zone,2 = Medium Risk,3 = Low Risk
Distribution of firehouses within five boroughs
Response time within three boroughs
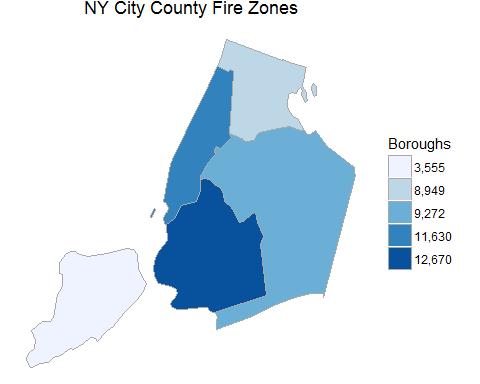
Fire zones based on the incident counts
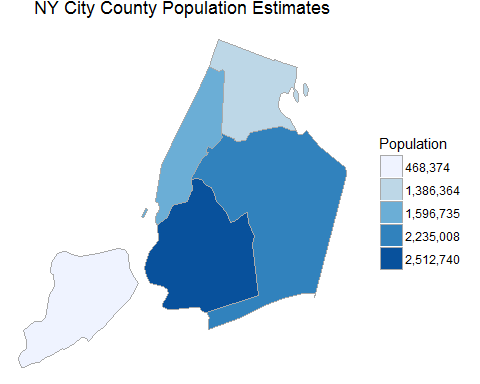
Distribution of Population among five boroughs