Data Science(part III)
Exploratory Data Analysis
探索绘图原则
- 表示可比的对比
- 表示因果 解释 机制 系统结构
- 表示多元变量(超过2)
- 证据整合 目的驱动非工具驱动
- 证据描述要标注限定恰当
- 内容为王
探索性绘图
R绘图系统
基础包
- 艺术家绘画模式
- graphics 包括基础包的绘图函数如plot, hist, boxplot
- grDevices 包括执行调用绘图设备函数如X11, PDF, PostScript, PNG
- 叠加函数 高度自由度
- 初始化新图 然后标注
- 以下命令熟记
- pch: the plotting symbol (default is open circle)
- lty: the line type (default is solid line), can be dashed, dotted, etc.
- lwd: the line width, specified as an integer multiple
- col: the plotting color, specified as a number, string, or hex code; the colors() function gives you a vector of colors by name
- xlab: character string for the x-axis label
- ylab: character string for the y-axis label
par():查找做图的画布参数 具体如下- las: the orientation of the axis labels on the plot
- bg: the background color
- mar: the margin size
- oma: the outer margin size (default is 0 for all sides)
- mfrow: number of plots per row, column (plots are filled row-wise)
- mfcol: number of plots per row, column (plots are filled column-wise)
- plot: make a scatterplot, or other type of plot depending on the class of the object being plotted
- lines: add lines to a plot, given a vector x values and a corresponding vector of y values (or a 2-column matrix); this function just connects the dots
- points: add points to a plot
- text: add text labels to a plot using specified x, y coordinates
- title: add annotations to x, y axis labels, title, subtitle, outer margin
- mtext: add arbitrary text to the margins (inner or outer) of the plot
- axis: adding axis ticks/labels
- 图形设备
- 图像一定要有设备
- 屏幕设备 Mac
quartz() windows windows() Unix/linux x11()
- 先调用后用
dev.off()关闭设备
- 矢量图设备 保真放大 元素过多体积庞大
pdf() svg() winmetafile() postscript()
- 位图设备 放大失真 基于像素
png() jpeg() tiff() bmp()
- 当前设备
dev.cur()
- 设置设备
dev.set(<integer>)
- 设备转移
dev.copy dev.copy2pdf
lattice
- 一站式解决
- lattice 包括框架图函数如xyplot, bwplot, levelplot
- grid 包括独立于基础绘图系统的网格绘图系统
- 一个函数解决问题 默认自定义空间少
- 返回
trellis类型对象 可单独存储
- 界面调整使用
panel选项
- 以下为常见函数
- xyplot: this is the main function for creating scatterplots
- bwplot: box-and-whiskers plots (“boxplots”)
- histogram: histograms
- stripplot: like a boxplot but with actual points
- dotplot: plot dots on “violin strings”
- splom: scatterplot matrix; like pairs in base plotting system
- levelplot, contourplot: for plotting “image” data
- 基本格式
xyplot(y ~ x | f * g, data)- 可同时展示分组信息及交互作用
ggplot2
- 基于图形语法理念
- 图形属性映射数据问题
- 自动处理界面 允许后期添加 结合base与lattice
- 默认友好
- 基础绘图
qplot()
ggplot() 通过叠加元素出图- 细节调整
xlab(), ylab(), labs(), ggtitle()
- 主题调整
theme()
- 做图需求
- 数据框 data.frame
- 属性映射 asethetic mappling
- 几何对象 geoms
- 条件 facets
- 统计转换 stats
- 范围量表 scales
- 坐标轴系统 coordinate system
数学绘图
- Tex语法
- 使用
expression()
?plotmath
色彩管理
colorRamp 返回01间数值 表示颜色过度colorRampPalette 返回8位颜色代码调色盘colors 返回可用颜色- RColorBrewer包 含有预先配色信息 序列 无序 两级
rgb产生三原色颜色 alpha 控制透明度- 绘图时用
col调用调色盘颜色
pal <- colorRamp(c("red", "blue"))
pal(0)
##      [,1] [,2] [,3]
## [1,]  255    0    0
pal(1)
##      [,1] [,2] [,3]
## [1,]    0    0  255
pal(0.5)
##       [,1] [,2]  [,3]
## [1,] 127.5    0 127.5
#####
pal <- colorRampPalette(c("red", "yellow"))
pal(2)
## [1] "#FF0000" "#FFFF00"
pal(10)
##  [1] "#FF0000" "#FF1C00" "#FF3800" "#FF5500" "#FF7100" "#FF8D00" "#FFAA00"
##  [8] "#FFC600" "#FFE200" "#FFFF00"
#####
library(RColorBrewer)
cols <- brewer.pal(3, "BuGn")
分层聚类
- 找到最近的 聚到一起 找下个最近的
- 给出距离范围与距离计算方法
- 欧氏距离 多维空间点距 开平方
- manhattan距离 出租车距离 绝对值
- 给出变量间或样本间的关系
- 图形可能不稳定 多少样本多少类
- 结果是确定的
- 选定cut点并不明显
- 应该首先用来探索
k-means聚类
- 固定聚类数 给出聚类中心 寻找最近的点 循环
- 需要聚类数与聚类距离范围
- 需要大量聚类 通过眼睛 交叉检验
- k的经验数值\( \sqrt{n/2} \) 或者根据解释的变量变化多少来选取
- 结果不确定 根据聚类数与迭代次数而变化
维度还原
- 找到最不相关的数来解释整体方差(统计)在这些数中选取个数最少的来解释原始数据(压缩)
- 不一定是真实向量的叠加
- SVD是PCA的一种解法 UDV三个向量 其中U表示行变化模式 D表示方差 V表示列变换模式 这样有助于解释主成分变化
- 标准化与否影响结果
- 计算量大
- 类似探索分析还有因子分析 独立成分分析 潜在语义分析
- impute包可补充缺失值
Reproducible Research
Replication
- 科学研究的的终极标准是研究证据可独立发现与验证
- 并非所有结果都可以重复
Reproducible
- 可重复的数据分析过程与代码
- 数据维度增高
- 现有数据可被整合入更大的数据集
- 计算机条件允许
研究流程
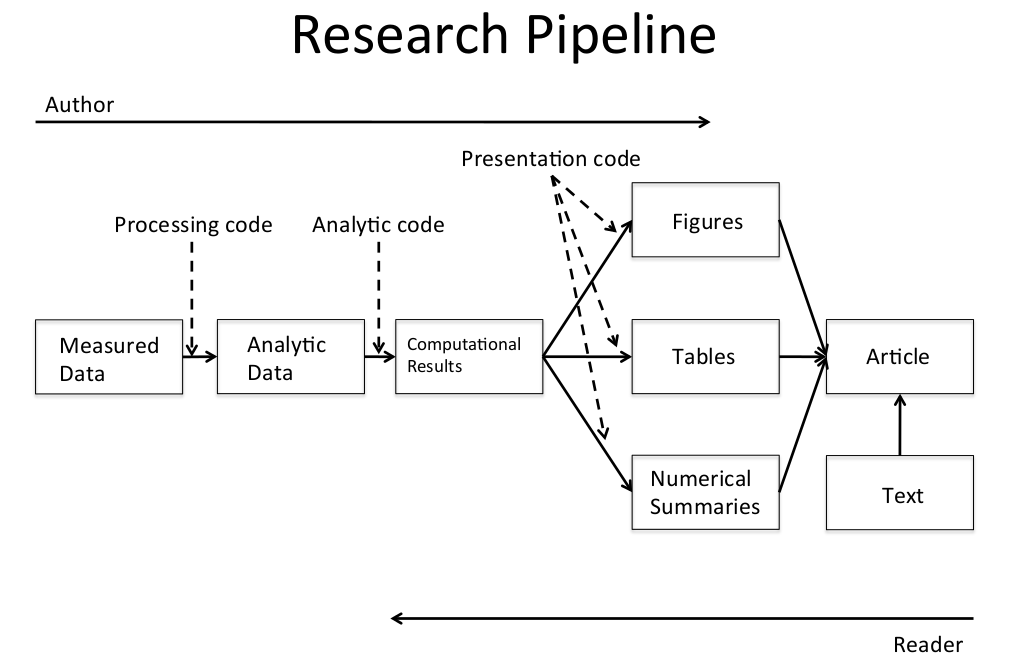
数据分析步骤
定义问题
定义理想数据
- 描述性的 <- 总体数据
- 探索性的 <- 有属性测量的样本数据
- 推断性的 <- 合适的总体 随机采样
- 预测性的 <- 来自同一总体 有训练集与测试集的样本
- 因果性的 <- 随机性研究
- 机械性的 <- 系统中所有组成部分的数据
决定可获取数据
- 网络免费数据
- 购买数据
- 注意使用条款
- 数据不存在 自己创造 <- 实验
获取数据
- 原始数据
- 引用来源
- 网络数据注明数据来源URL与获取时间
整理数据
- 原始数据需要整理
- 如果事先处理过要搞清楚如何处理的
- 了解数据来源
- 需要重新格式化 采样 <- 记录步骤
- 判断数据是否合适 不合适重新获取
探索性数据分析
- 描述性总结数据
- 检查缺失值
- 绘制探索性图
- 尝试探索性分析 例如聚类
统计预测/建模
- 基于探索性分析
- 根据问题确定方法
- 数据转换要解释
- 测定的不确定性要考虑
解释结果
质疑结果
整合写出结果
- 从问题角度出发
- 形成一个故事
- 不要包含分析过程除非用来说明问题 消除质疑
- 以故事而不是时间顺序描述
- 图片要漂亮
写出可重复的R代码
数据分析文件结构
Data
- Raw data 来自网络在Readme里注明url 描述 日期
- Processed data 命名体现处理过程 Readme里注明处理过程
Figures
- Exploratory figures 不必考虑装饰
- Final figures 只考虑装饰
R code
- Raw scripts 不必过分注释 版本控制 不一定用得上
- Final scripts 注释清晰 包括处理细节 只包括文章需要费分析
- R Markdown files (optional)
Text
- Readme files 按步骤记录清晰
- Text of analysis 包括前言 方法 结果 结论 讲故事 有引用
文本化统计编程-Knitr
- markdown是轻量化结构语言
- R markdown 是轻量化统计结构语言
- 文本+代码块 逻辑清晰
- 文本语言可用latex markdown
- 代码块可用R
- 不用保存输出
- 可缓存结果 cacher包
结果通讯
研究论文的信息层级
- 题目/作者名单
- 摘要
- 主体/结果
- 支持材料/细节
- 代码/数据
邮件汇报的信息层级
- 题目最好一行一句
- 描述问题 如何实验 总结发现
- 简明扼要
- 如果有问题 写成yes/no形式
- 附件齐全严谨
检查列表
- 数据选取得当
- 问题简单专一
- 队友靠谱
- 兴趣驱动
- 不要手动处理数据 全部交给计算机
- 少用交互界面 用命令行界面并记录历史
- 使用版本控制 处理降速而冷静
- 记录软件操作环境
sessionInfo()
- 不保存结果保证数据可重复
- 使用随机数要说明种子
- 原始数据-处理数据-分析-报告
- 考虑从哪一步开始数据重复性变差
基于证据的数据分析
- 可重复性研究不保证结果是对的
- 发表后研究存在动因 应关注数据生成前的过程
- 设定基于证据研究的路线图
- 减少研究人员的自由度
- 提出区域研究范式