We've all seen this, the 95% confidence level.

https://faculty.elgin.edu/dkernler/statistics/ch09/images/sample-proportions.jpg
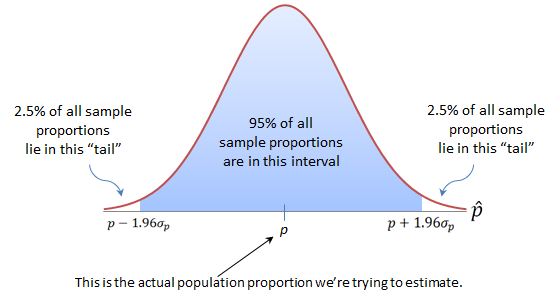
But what if you want to be less confident? What if you want to be a lot less confident?
Or even more confident?
CI Productions
We've all seen this, the 95% confidence level.
https://faculty.elgin.edu/dkernler/statistics/ch09/images/sample-proportions.jpg
But what if you want to be less confident? What if you want to be a lot less confident?
Or even more confident?
Our app features guinea pig tooth growth data. At a 95% confidence level, you get this. However, the interactive visualizer allows you to explore the confidence interval at other confidence levels.

You pick a confidence level, and watch the error bars grow or shrink.
At a 95% confidence level, we're 95% sure that the true mean is within the error bars. However, at lower confidence levels, we're less sure, so the interval shrinks. To be more confident, we'd need to increase the interval to be surer that we're capturing the true mean.
If we cover the entire range, we can be 100% confident that the true mean is in there somewhere. Conversely, zero confidence shows no bars.


Code adapted from R Cookbook:
http://www.cookbook-r.com/Graphs/Plotting_means_and_error_bars_%28ggplot2%29/
