RonR! First seminar
Introduction to R and its strengths
Jorge Cimentada
5th of March of 2016
![]()
Outline
What is R?
Do you know what General Public License or GNU is?
How does R work?
Getting started
Let's go to R!

Downloading Rstudio

How does Rstudio look?
What are R's strengths?
What are R's strengths?
R's weaknesses
R graphics - Teaching
Problem = Explanatory graphs for teaching

R graphics - Teaching
Problem = Showing overlapping variation using distributions

R graphics - Teaching
Problem = Showing overlapping variation using Venn diagrams

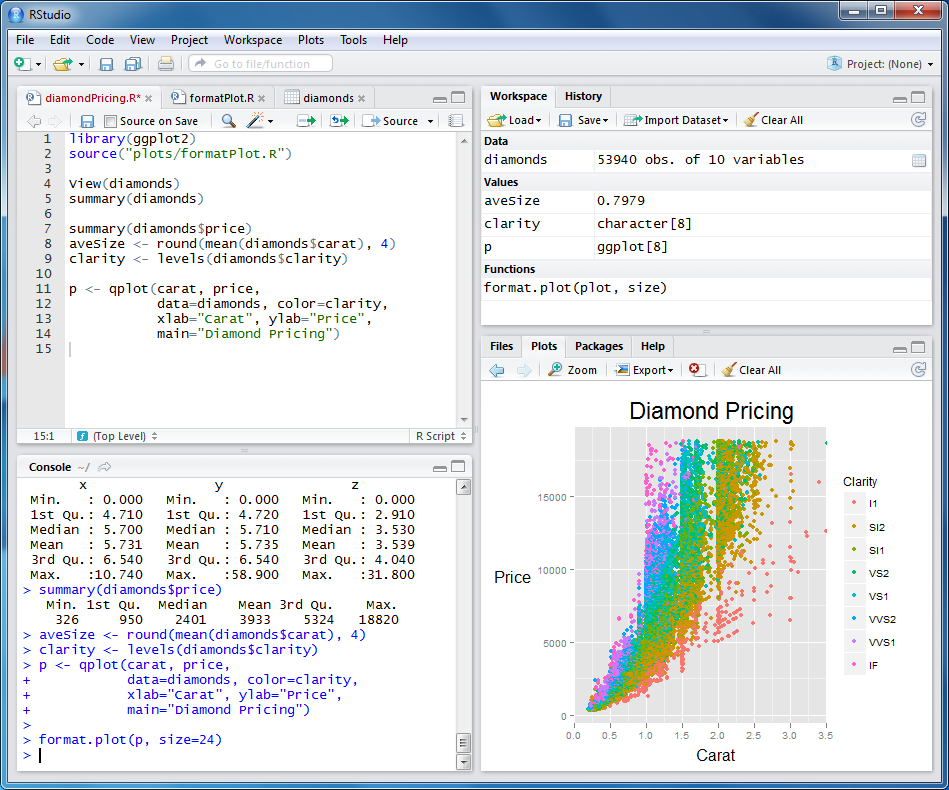
R graphics - Exploratory analysis
Problem = Nicely formatted barplot with minimum code
## Run this in your console
library(ggplot2)
ggplot(diamonds, aes(clarity, fill=cut)) + geom_bar()

R graphics - Exploratory analysis
Problem = Visualizing a bivariate relationship filtered by two variables
## Run this in your console
library(ggplot2)
qplot(wt, mpg, data=mtcars, size=qsec, color=factor(carb))

R graphics - Exploratory analysis
Problem = Visualizing a bivariate relationship by a categorical variable
## Run this in your console
library(ggplot2)
qplot(mpg, wt, data = mtcars, facets = cyl ~ ., geom = c("point", "smooth")) +
    coord_flip()

R graphics - Exploratory analysis
Problem = Combine existing graphs in a nice format
## Do not run this. It's incomplete code.
multiplot(p1, p2, p3, p4, cols = 2)

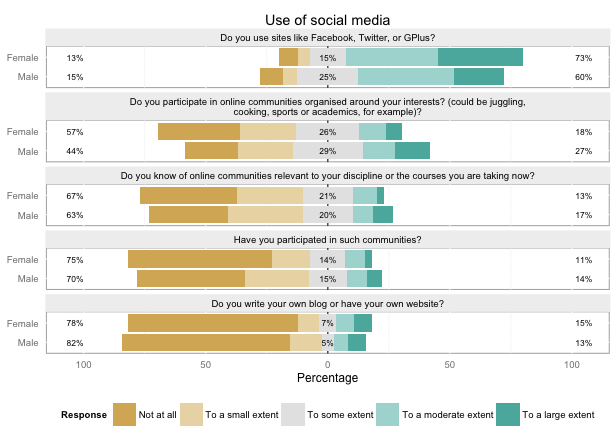
R graphics - Exploratory analysis
Problem = Visualize Likert type questions quickly
R graphics - Advanced
Problem = Visualizing statistical techniques

R graphics - Advanced
Problem = Plotting distributions next to scatterplots

R graphics - Advanced
Problem = Making graphical summaries

R graphics - Interactive graphs
R graphics - Interactive graphs
R graphics - Interactive graphs
R graphics - Interactive graphs
R graphics - Interactive graphs
R graphics - Interactive graphs
R graphics - Maps

R graphics - Maps

R graphics - Maps
Crime density in Baltimore

R graphics - Maps

R graphics - Maps

R graphics - Maps

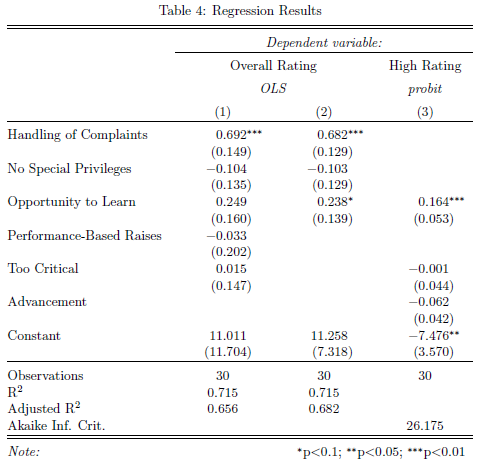
R statistics - Summary statistics ouput
You can get summary or regression statistics using the stargazer package