RonR! First seminar

Introduction to R and its strengths

Jorge Cimentada
5th of March of 2016

What is R?

  • R is a language and environment for statistical computing and graphics
  • R provides a wide variety of statistical and graphical techniques, and is highly extensible(linear and nonlinear modelling, classical statistical tests, time-series analysis, classification, clustering, …)
  • One of R’s strengths is the ease with which well-designed publication-quality plots can be produced

Do you know what General Public License or GNU is?

  • You have the freedom to run the program as you wish, for any purpose (freedom 0).

  • You have the freedom to study how the program works, and change it so it does your computing as you wish (freedom 1).

  • You have the freedom to redistribute copies so you can help your neighbor (freedom 2).

  • You have the freedom to distribute copies of your modified versions to others (freedom 3).

How does R work?

Getting started

  • Go to www.r-project.org
  • Downloads: CRAN
  • Set your Mirror: Anywhere in Spain is fine.
  • Select 'Download R for Windows'.
  • Select base.
  • Select R 3.2.3 for Windows
    • The others are if you are a developer and wish to change the source code.

Let's go to R!

R interface

Downloading Rstudio

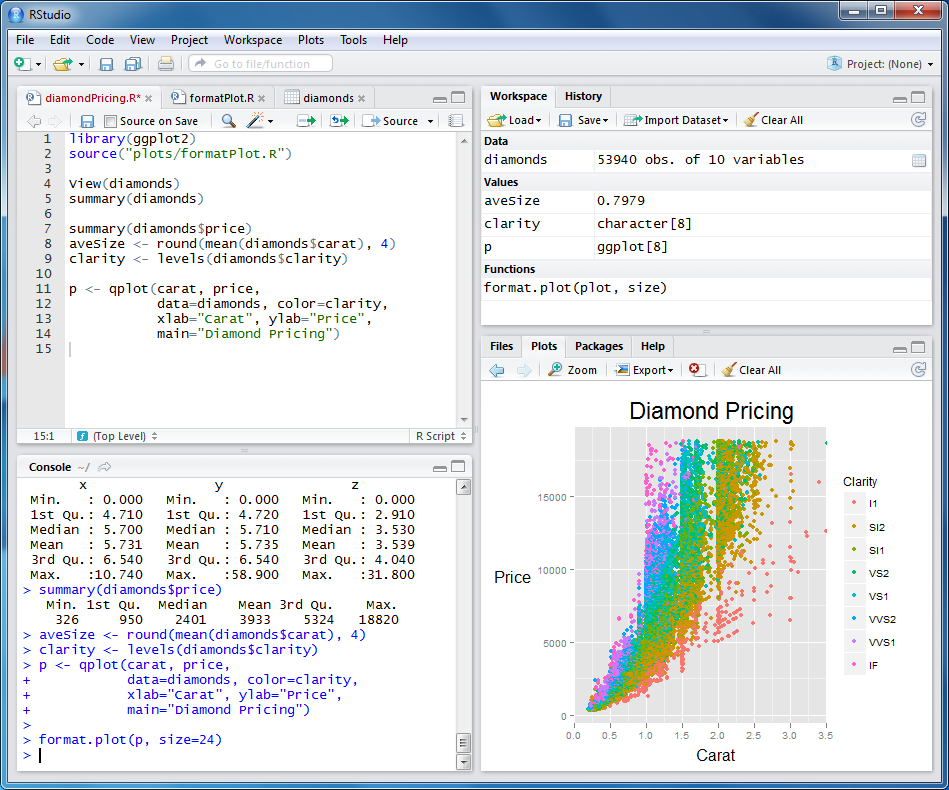
How does Rstudio look?

R studio interface

What are R's strengths?

Adapted from 'R for Stata users' by Muenchen and Hilbe

  • Comprehensible repertoire of statistical techniques
  • R is directly accessible from many statistics packages like SAS, SPSS and Stata.
  • Every aspect of R is open for anyone to modify in any way they like.
  • R also offers the very flexible and powerful Grammar of Graphics approach. Developers have even gone so far as replacing R’s core graphical system.
  • R is free. This helps to attract developers and is a major reason that there are so many add-on packages for it.

R graphics

plot of chunk unnamed-chunk-1

R graphics

plot of chunk unnamed-chunk-2

R graphics

plot of chunk unnamed-chunk-3

R graphics

R facebook map This is among the most recognized graphs in R!

R graphics

Cosas que faltan:

  • Graficos ggvis pero con su código arriba(2 o 3)
  • Graficos con ggplot mas elaborados(2 o 3)
  • Gráficos ggvis interactivos con su codigo
  • Algunos gráficos con Plotly
  • Algunos gráficos con Shiny
  • Algunos gráficos con Rcharts
  • Some maps with their code EASY ones
  • Some maps with google maps