class: center, middle, inverse, title-slide .title[ # Advanced quantitative data analysis ] .subtitle[ ## Introduction ] .author[ ### Mengni Chen ] .institute[ ### Department of Sociology, University of Copenhagen ] .date[ ### 31/08/2026 ] --- #Introduction About me - Associate professor in Copenhagen University since 01/09/2026 - Assistant professor in Copenhagen University (01/05/2021-31/08/2026) - Teaching: sociology of family & population studies (BA), advanced quantitative data analysis (MA), basic statistics (BA) - Research: family formation and dissolution, fertility, ageing, population health, population policies - Research Experience: Cologne University, Germany; Catholic University of Louvain, Belgium; Wittgenstein Centre for Demography, Austria - Phd in University of Hong Kong (2013-2017) - **My office hour**: During Week 36-38, 10:30-11:30 am, Room 16.1.48, Building 16 --- #Introduction About you - Name - Year and department --- #Introduction About what you know [I would like to know what you have known about R and statistics](https://docs.google.com/forms/d/e/1FAIpQLSdzkyzduRwtcJlCIIIajYbN_wXJhWMksap86UCWnBt2Q7fKPg/viewform?usp=publish-editor) --- #[What's your expectation about the course](https://padlet.com/ucph/what-s-your-expectation-about-the-course-1e570op3ln3xrfd9) --- #About the course - Main content - Recapture of R: R basics (Mengni Chen) - Cross-sectional data analysis: OLS, OB-decomposition (Mengni Chen) - Panel data management (Fritz Troensegaard & Kasper Lykke Dausel) - Panel data analysis I: fixed effect (Stephan Dochow-Sondershaus) - Panel data analysis II: difference in difference (Stephan Dochow-Sondershaus) - Learning approach - Lecture - Small in-class exercise - Bring lap-top every class - Fagcafe after class: Wednesday 15:00-17:00; in Room CSS 4-1-24 for Week 36-49, in CSS 4-1-30 for Week 50 - Victoria Ritzau Pagh is our TA. --- #Assessment - Portfolio of 3 assignments: select one of the three topics - P1: 3 pages for introduction, OLS regression, and OB-decomposition - Deadline is Oct.4, 23:59. - P2: 3 pages for describing what is fixed effect and applying fixed effect - Deadline is Nov.29, 23:59. - P3: 3 pages for describing what is DID and applying DID - Deadline is Dec.13, 23:59. - Please submit your portfolio even if it is not 100% complete. - A final combined product for exam: max 10 pages for all - Individual or group work: 10 + 5 pages per extra person - Final exam: 12 January 2027, upload in Digital Exam before 12:00 (noon, Danish Time) - Re-exam: 15 February 2027, written exam with new questions --- #Feedback - Portfolio 1: all get feedback from the teacher - Portfolio 2: randomly 50% get feedback from the teacher + peer feedback - Portfolio 3: the rest 50% get feedback from the teacher + peer feedback - Overall, everyone gets twice feedback from the teacher + twice peer feedback --- #Three topics to choose - Q1: How does first childbearing affect women’s subjective wellbeing of women? - Q2: How does entry into a partnership affect people’s subjective wellbeing? - Q3: How does partnership break-up affect people’s subjective wellbeing? - **Choose one topic for all your 3 portfolios** - The aim of 3 portfolios is to answer the chosen question using different methods. --- #How to measure subjective wellbing You can choose one of the following measurements as your outcome variable: - Subjective satisfaction with work - Subjective satisfaction with family - General life satisfaction --- #Access to the Pairfam data - [What is pairfam](https://www.gesis.org/en/services/finding-and-accessing-data/selected-german-research-projects/pairfam) The survey data is collected annually on a national level. The initial sample comprises more than 12,000 randomly selected individuals from the three birth cohorts 1971-73, 1981-83 and 1991-93. The multi-actor survey additionally includes the current partners of these young adults, up to three (step)parents and children at the age of 8 to 15 years. The resulting data base opens up new potentials for the analysis of partnership and family relations as they develop over time. --- #How to use open AI in the course - UCPH policy for open AI: download, fill and attach the template in your final exam - Is it ok to use? - yes: check codes, ask questions, get some ideas - no: just copy the codes without understanding what you are copying - mindful and critical --- #Other info - Absalon setup - Data: go to absalon → this course → files → Data - **Women data: can be used to answer Q1** - **50%data: can be used to answer the Q2 and Q3** - Codebook - Variables, pairfam Waves 1-13.xlsx - Reading for each session : go to absalon → this course → files → Reading - Example reading: literature related to the three topics - go to absalon → this course → files → Example reading - Assignment and exam examples - go to absalon → this course → files → Assignment and exam examples --- #What is R If you're mainly interested in using regression to analyze a specific survey, it is 1. ...a rather tedious stats programming language. 2. ...basically a calculator: ``` r 1+1 ``` ``` ## [1] 2 ``` ``` r x <- 1 x+1 ``` ``` ## [1] 2 ``` --- #What is R If you enjoy coding and working with several data sources at once, it is 1. ... a great platform for (social) data science of 2. ... networks, text, geo, pictures... 3. ... an all in one solution.→ I coded these slides in R! 4. ... a huge, dynamic and cooperative community. 5. ... a very higher chance to get a job in Danish labor market! [why you should use R](https://www.youtube.com/watch?v=9kYUGMg_14s&list=PLbh5g6tUnVSRwojrTf-ZBTXeCs-oYh9DV&index=94&t=3s) --- #What you will learn in R (Social) Data Science 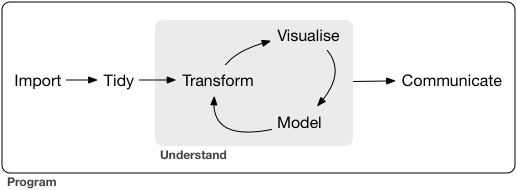 .backgrnote[*Source*: Grolemund and Wickham (2017)] <src="https://d33wubrfki0l68.cloudfront.net/571b056757d68e6df81a3e3853f54d3c76ad6efc/32d37/diagrams/data-science.png" width="70%" style="display: block; margin: auto;" > --- #Install R and R - [First, download R and install](https://www.rstudio.com/products/rstudio/download/#download) - [Second, download R studio and install ](https://www.rstudio.com/products/rstudio/download/#download) - Video on how to install them in [Windows](https://www.youtube.com/watch?v=_2sewGCA0y4) and [Mac](https://www.youtube.com/watch?v=LanBozXJjOk) - If you don't manage to install R and Rstudio, you can use [Rstudio cloud](https://posit.cloud/) - [Video on how to use Rstudio cloud](https://www.youtube.com/watch?v=uK1Va_UWQFc) --- #Interface in R <img src="https://d33wubrfki0l68.cloudfront.net/8a64bb047429d7ae0e2acae35c40e421e6439bf6/80e5d/diagrams/rstudio-editor.png", width="550px" height="550px" style="position:absolute; top:120px;"> --- # R Studio workflow 1. Use **Projects** to manage all files (scripts, data, figures and tables) belonging to the same project. 2. Use **R scripts** to write down your codes, so you can reproduce your results by running the codes in the R script. --- #Set up your own Rproject and Rscript - Click on the Project button. - "New Directory" - "New Project" - Finally, a name for the folder and under "Browse" where you want that folder to be located. - Done! Now you should find an empty folder under the path your wanted it to be set up. - In the future, start RStudio by double clicking on the project icon in your folder. - You can follow the procedures to create your R project and R script in [this website, click here](https://rpubs.com/fancycmn/1213843). - [Video on creating a project: 3'38-7'32](https://www.youtube.com/watch?v=wqOme7xsZvs) - [Video on openning an existing project: 9'35-10'29](https://www.youtube.com/watch?v=wqOme7xsZvs) --- #Let us do a in-class quiz - Go to absalon and find the quiz under Week 36.1 in the "Slides" module --- #R scripts (wait and see) OK, you are good to go! Pro tip: Use the R Script to take notes during the lecture! <span style="color:blue">**# take notes**</span> ``` r #take notes x <- 1 x+1 ``` ``` ## [1] 2 ``` --- #First steps with R - Creating objects - R is an object-oriented programming language. We create objects with the assignment operator - The assignment operator may be used in both directions: <-, or ->. This can help you write more legible code. - Shorthand in Windows, press <span style="color:blue">**alt**</span> and <span style="color:blue">**-**</span> together - Shorthand in Mac, press <span style="color:blue">**Option**</span> and <span style="color:blue">**-**</span> together - Run code - For Windows, press <span style="color:blue">**Ctrl**</span> and <span style="color:blue">**enter**</span> together - For Mac, press <span style="color:blue">**cmd**</span> and <span style="color:blue">**enter**</span> together --- #First steps with R - Creating objects - Objects can contain all kinds of information. ``` r # Create a new object "test_object" and assign to it the result of 5 + 2 test_object <- 5 + 2 #printing the result: type test_object in the "Console" and see what you get test_object ``` ``` ## [1] 7 ``` ``` r # text can also be an object text_object <- "I love this course so much!" #pring the results: type text_object in the "Console" and see what you get text_object ``` ``` ## [1] "I love this course so much!" ``` --- #First steps with R compare the two sets of codes ``` r test_object1 <- 5+2 test_object1 + 3 test_object1 ``` ``` r test_object2 <- 5+2 test_object2 <- test_object2 + 3 test_object2 ``` -- If you don't use the assignment operator (<-), R will simply print the result of an operation without changing that object (i.e., without any further consequences). -- If you actually want to create or modify objects, you need to use the assignment operator and explicitly assign the result of your operation to the object you want to change. --- #First steps with R: Use functions function_name(argument1 = value1, argument2 = value2, ...) Example 1: The class() function tells you what class/type of object your are dealing with: -- ``` r class(test_object1) # test_object1 contails whole numbers, so it is: ``` ``` ## [1] "numeric" ``` -- ``` r class(text_object) # "text_object" contains a sentence, so it is: ``` ``` ## [1] "character" ``` -- ``` r class(table) #table is a function in R ``` ``` ## [1] "function" ``` --- #First steps with R: Use functions Example 2: The **seq()** function, for instance, produces a sequence of numbers and has (among others) the arguments from and to. ``` r yet_another_object <- seq(from = 1, to = 5) yet_another_object ``` ``` ## [1] 1 2 3 4 5 ``` -- ``` r #Try to run alphabet <- seq(from = "a", to = "z") ``` -- Functions will throw an error message, if you feed them with an object of a class it cannot handle. --- #First steps with R: operators Arithmetic operators: plus=<span style="color:blue">+</span>, multiply=<span style="color:blue">*</span>, power=<span style="color:blue">^</span>, square root=<span style="color:blue">sqrt()</span> ``` r 2 + 3 ``` ``` ## [1] 5 ``` ``` r 2 * 3 ``` ``` ## [1] 6 ``` ``` r 2^3 ``` ``` ## [1] 8 ``` ``` r sqrt(36) #square root as a function ``` ``` ## [1] 6 ``` --- #First steps with R: operators Logical operator - and = <span style="color:blue">**&**</span>; - or = <span style="color:blue">**|**</span>; - not= <span style="color:blue">**!**</span>; - belong = <span style="color:blue">**%in%**</span>; - equal = <span style="color:blue">**==**</span>; - not equal= <span style="color:blue">**!=**</span>; --- #Logical operator in action ``` r x <- 2 x==3 ``` ``` ## [1] FALSE ``` -- ``` r x!=3 ``` ``` ## [1] TRUE ``` -- ``` r x > 5 & 6 # greater than 5 and greater than 6 ``` ``` ## [1] FALSE ``` -- ``` r x > 5|1 # greater than 5 or greater than 1 ``` ``` ## [1] TRUE ``` --- #Other basics R has a steep learning curve and is, at times, simply frustrating. The documentation of a specific function can be accessed via typing **?<Name of function>** ``` r ?seq ?sqrt ``` Clean the objects or data you create ``` r rm() #rm stands for remove rm(x) ``` Clean the output shown in the console ``` r press ctrl and l ``` --- #Take home 1. R is an object-oriented programming language. Objects are basically containers and they can contain anything: data, functions, other objects, results, figures, and more ... Objects can be called by their name, which needs to start with a letter. If you just type the name of an object, R prints the object. 2. Functions do stuff with objects, which we assign as values to a function's arguments. What exactly a function does, depends on the class of an object. Functions themselves are objects too. 3. Important code - "?": View a function's help file. - "#": defines a comment in your code. Comment as much as possible! - "<-": is the assignment operator of R. - +, -, *, ^ : Arithmetic operators - & means "and", | means "or", ! means "not", == means testing whether the two are equal - class(): tells you the class of an object **Reference**: Grolemund, G. and H. Wickham (2017). R for Data Science. O'Reilly. --- class: center, middle #[Exercise: 1-6 necessary; 7-9 optional](https://rpubs.com/fancycmn/1214111)