Grimmer et al. (2021)

Grimmer et al. (2021)

What is my task informs

The ML approach to take which I

Evaluate accordingly

ML combines elements of the quantative deductive and qualitative inductive paradigms.

ML is a tool to synthesise large data in addition to accurately modelling multiple variable associations at once.

ML can be used both for hypothesis testing when an outcome is known (supervised machine learning) and for generating clusters of meaning when there are no known outcomes (unsupervised machine learning).

Supervised ML

Labelled data required in training an algorithm.

The algorithm is trained on data to predict which cases from unseen data belong to given labels.

Human evaluation is needed to ensure accurate and meaningful prediction.

Example of applications: Regression

Say, you research political themes covered in the written media in the past decades. Your sample then would be thousands of written texts.

Supervised machine learning can help with an automatic text classification.

Un-supervised ML

No labelled data available.

An algorithm is calibrated to organize data in systematic patterns.

Human evaluation is needed to ensure meaningful data organization.

Example of application: Cluster analysis

Say, you want to have the data ‘self-organize’ itself. Data from large bodies of text, big data, etc.

Unsupervised machine learning can detect clusters of meaning from large volume of data.

Data may be numeric following experimental or survey research or data may be corpi of text.

ML is a powerful approach to data analysis that involves so-called big data, often comprising millions of data points and variables.

ML may likewise be used on more ‘restrictive’ datasets with thousands of observations on tens to hundreds of variables.

ML may be an ‘overkill’ if used to analyze smaller scale data such as from individual experiments that usually involve sample sizes of hundreds of participants and has on average 10 variables.

A researcher may apply ML to predict outcomes, generate data-driven insights for theory development, or study causality.

Discovery

Is label ‘X’ accurate in describing A through Z data points?

Examples: Clustering, Factor models

Measurement

Does measurement instrument ‘J’ resulting in A through Z data points capture a theoretical construct accurately?

Examples: Hand coding, Improving model fit indices

Inference–Prediction

Given A through Z data points in this context and time, how accurate is the prediction of ‘Y’ in another context and in the future.

Examples: Forecasting of presidential elections

Inference–Causal

How does outcome ‘Y’ changes if a change occurs in feature A transforming it into A*.

Examples: Experiments

Discovery

Quantitative method tends to ignore the process of concept formation whereas this is an established procedure in the qualitative method.

Machine learning boosts data driven discovery of new concepts from data.

Dimensionality reduction and automated feature engineering can suggest organizations of large data sets that might otherwise be hard to find.

Unsupervised machine learning is applicable.

Not all data organizations are meaningful which is why a final evaluation must be carried out by a human.

Ultimately, it should not matter which approach to data organization is being used - whether human made data or data-generated one. It should matter whether the data organization itself carries meaning that a researcher may use.

Discovery–Applications

Clustering

The goal is to partition observations into mutually exclusive categories (clusters).

The ML algorithm identifies the best placement of each observation \(i\) into one of \(K\) clusters.

Typologies:

  • K-means clustering
  • CLARA - Clustering Large Applications
  • Agglomerative clustering (hierarchical clustering)
  • DBSCAN (number of clusters not pre-specified)

For a comprehensive guide for applications in r see Kassambara (2017) (also the source for these images)

Discovery–Applications

Factor models

Search for a low dimensional representation of complex dimensionality in the data.

Seeks to reduce large and complex data structure to interpretable dimensions of meaning.

Example of ML applications for factor analysis identification, see Goretzko & Buehner (2020)

Example of ML applications for factor analysis identification, see Goretzko & Buehner (2020)

Discovery–Note of caution

ML applications may lead to the discovery of new ways to organize the data. This might go against established theory or it may be counterintuitive.

Note that not all ML generated discoveries are indeed meaningful. The researcher must be vigilant and consider potential personal and data biases.

On the other hand, a researcher might hesitate before accepting a novel way of organizing the data.

Given that all established protocols have been observed, and indeed the data organize better in this newly found way, then the researcher should report the finding while being transparent about the code, procedure, and training data.

Measurement

Relevant when data – as in numbers or text – are available and the researcher wants to interpret observations as measurement of quantities of a theoretical construct.

Special case: When data that were not collected for the specific purpose of the research one intends on doing.

ML helps to gain evidence that the available data can be used to measure quantities of a theoretical construct.

The goal is to validate the new measurement in view of its accuracy – this may be done with indicators as well as based on human evaluation.

Measurement–Applications

Hand coding

Manual classification of observations into a set of categories that are determined before the analysis begins.

Typically, multiple coders are trained to reach a pre-determined level of agreement. But, full agreement cannot be reached and thus when interpreting results there will always be a degree of bias.

Methods have been developed to improve the results of hand coding, but clear solutions remain an ongoing task (see for a debate Chen et al., 2020).

ASReview to boost article screening in literature reviews, see Quan et al. (2024)

ASReview to boost article screening in literature reviews, see Quan et al. (2024)

Measurement–Applications

LASSO regression

LASSO stands for Least Absolute Schrinkage and Selection Operator and it helps with model fit improvement.

Lasso regression is a machine learning method that performs both variable selection and regularization to improve accuracy and interpretability of models.

It tends to outperform standard regression such as OLS and stepwise regression in specific situations (see Zhou et al., 2024).

Lasso seeks to balance variance reduction with model simplicity. Can be a useful tool especially in complex models with multiple variables.

More on this in the practical sessions.

Measurement–Note of caution

One-time successful measurement does not guarantee its validity and reliability in general.

Scientific trust in measures must be

  • iterative: measurement is refined and improved on over multiple iterations
  • cummulative: measurement gains trust if it holds across contexts and situations
  • built on open science: measurement can be improved and tested by others only if exact specifications are available for reproduction purposes

In other words, measurement cross-validation must be undertaken Rooij & Weeda (2020).

Prediction

Correlation is commonly applied to identify within data patterns of associations whereas prediction seeks to maximize cross-data accuracy in patterns of associations.

A correlation \(r(A,B)\) found in context X will predict the strength and direction of \(r(A,B)\) in context Z with high accuracy.

Data are needed with known labels from theory or past experience.

Supervised machine learning is applicable.

Prediction–Applications

Missing values imputation

Objective latent indicators are not always available, or they are incomplete, for instance—when people cannot or are unwilling to give sensitive data.

When subjective latent indicators are available, ML can be used to predict who is not willing or cannot give data or provide distorted data.

One application would be to supplement missing values using ML.

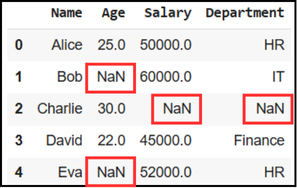
Common techniques implemented in r are:

  • Multiple Imputation by Chained Equations (MICE), Azur et al. (2011) (r-package = mice)
  • K-Nearest Neighbors (KNN) imputation, Murti et al. (2019) (r-package = VIM or caret)
  • regression imputation, (r-package = mice or missForest)

Prediction–Applications

Generate theoretical hypotheses

Traditionally, in quantitative research, new explanatory variables are looked at to test new theoretical hypotheses.

Theoretical intuition is thus critical whereas statistical indicators such as least squares or AIC and BIC model comparisons give an indication of model adequacy.

ML can help identify adequate new explanatory variables, dimensions, while testing new theoretical hypotheses.

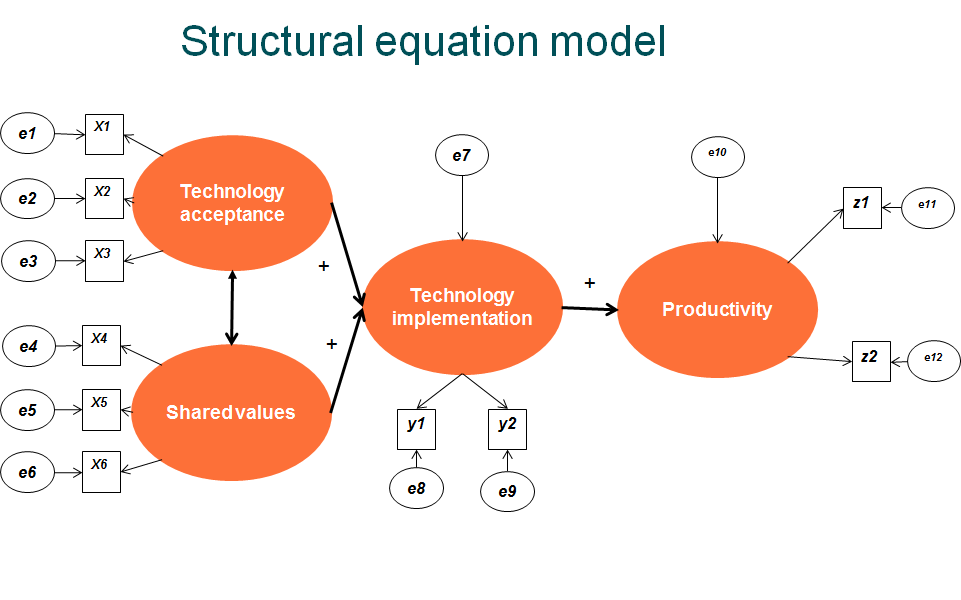
Example of application: machine learning approach to detecting model misfit in SEM, Partsch & Goretzko (2026)

Prediction–Note of caution

(David) Hume induction problem: The fact that the experience thus far has been X, it would be an assumption that the same applies hereafter. Past experience alone is insufficient to generate precise predictions – there will always be a degree of randomness.

Model overfitting: Overfit model fits itself to noise and therefore random fluctuations in the training data, misinterpreting it for signals.

Overfitting is a precision problem – too much precision of a model in explaining the outcome may be an artefact of the data looked at. Which is why sometimes, some noise is indeed a better thing to have when the goal is to have a model that holds in across datasets.

‘Failed’ forecasting of US presidential elections 2024. Source Wikipedia.

‘Failed’ forecasting of US presidential elections 2024. Source Wikipedia.

Causal

Causality implies direction (A>B and not B>A) and temporal order (A first then B).

Data are needed with known labels and potential predictors from theory. Supervised machine learning is applicable.

Data are needed to systematically tease out the cause effects of independent variable A on outcome variable B. Experimental settings with control groups as well as longitudinal assessments are the standard.

Limitations of traditional approaches to testing causality:

  • Reliance on strong assumptions (assumptions may be difficult to apply)
  • Covariate limitations (missing key variables can introduce confounding)
  • Assumption of data relationships (linear association between cause and effect may be an inaccurate data representation)
  • Heterogeneity analysis limitation (the implicit assumption that causal effects are consistent across groups may not always be true with some groups potentially responding differently leading to significant causal heterogeneity)

Causal–Applications

Heterogeneous treatment effects

An effect may be different across individuals or groups and thus ML may help the researcher gain insights into adaptive (individual or group specific) causal effects.

Example: “Do your civic duty – Vote!

Mail informing voters that their neightbors will know if they voted, increases voterturnout, Gerber et al. (2008)

Mail informing voters that their neightbors will know if they voted, increases voterturnout, Gerber et al. (2008)

ML algorithm detects that the treatment had heterogeneous effects, and in some cases it even backfired, Kuenzel et al. (2020)

ML algorithm detects that the treatment had heterogeneous effects, and in some cases it even backfired, Kuenzel et al. (2020)

Sending such a mail may have greater impact in the group who voted 3 times as no backlash was observed (no red bars in the upper part of the right figure) and it is the biggest group (see box-plot in the lower part of the right figure).

Causal–Note of caution

Choices in algorithm coding may carry over implicit biases, for instance, the choice of categorizing a continuous variable such as age into age groups of young, adults, and older people will have consequences for the research field as well as policy.

Researched and discussed in the literature under the term algorithmic bias. See Kordzadeh & Ghasemaghaei (2021).

Algorithm optimization must be informed by existent literature, theory, as well as larger ethical discourses.

Bias can occur in any of the steps involving ML algorithms, Fazelpour & Danks (2021)

Bias can occur in any of the steps involving ML algorithms, Fazelpour & Danks (2021)

Erik Paessler will take over for the practical sessions.

The focus will be on classification tasks, regression, and prediction.

Starting with the next session, bring your laptop and make sure you have the following installed:

Note on genAI

Of course, you may use genAI to help with the code. It is inevitable at this stage.

Your decisions and interpretations are however essential. Do not accept the suggestions offered without scrutiny!

Use this prompt in genAI tools such as Microsoft Copilot.

give me a simple example of machine learning code written in r for conducting a k-means cluster analysis with the iris dataset and show me a ggplot graph at the end

Check the suggested code. Copy-paste if you wish to your r. Alternatively, use this other prompt to ask Copilot for a rendered figure.

render the ggplot for me and give me a downloadable png picture format

Rendered k-means clusters based on iris data and the Copilot code provided. Prompts used 30.4.2026

Rendered k-means clusters based on iris data and the Copilot code provided. Prompts used 30.4.2026

Reference list

Azur, M. J., Stuart, E. A., Frangakis, C., & Leaf, P. J. (2011). Multiple imputation by chained equations: What is it and how does it work? International Journal of Methods in Psychiatric Research, 20(1), 40–49. https://doi.org/10.1002/mpr.329
Chen, N.-C., Drouhard, M., Kocielnik, R., Suh, J., & Aragon, C. R. (2020). Using machine learning to support qualitative coding in social sciences: Shifting the focus to ambiguity. ACM Transactions on Interactive Intelligent Systems, 8(2), 1–20. https://doi.org/10.1145/3185515
Fazelpour, S., & Danks, D. (2021). Algorithmic bias: Senses, sources, solutions. Philosophy Compass, 16(8), e12760. https://doi.org/10.1111/phc3.12760
Gerber, A. S., Green, D. P., & Larimer, C. W. (2008). Social pressure and voter turnout: Evidence from a large-scale field experiment. American Political Science Review, 102(1), 33–48. https://www.jstor.org/stable/27644496
Goretzko, D., & Buehner, M. (2020). One model to rule them all? Using machine learning algorithms to determine the number of factors in exploratory factor analysis. Psychological Methods, 25(6), 776–786. https://doi.org/10.1037/met0000262
Grimmer, J., Roberts, M. E., & Stewart, B. M. (2021). Machine learning for social science: An agnostic approach. Annual Review of Political Science, 24, 395–419. https://doi.org/10.1146/annurev-polisci-053119-015921
Kassambara, A. (2017). Practical guide to cluster analysis in r. Unsupervised machine learning. STHDA. https://xsliulab.github.io/Workshop/2021/week10/r-cluster-book.pdf
Kordzadeh, N., & Ghasemaghaei, M. (2021). Algorithmic bias: Review, synthesis, and future research directions. European Journal of Information Systems, 31, 388–409. https://doi.org/10.1080/0960085X.2021.1927212
Kuenzel, S. R., Sekhon, J. S., Bickel, P. J., & Yu, B. (2020). Metalerners for estimating heterogeneous treatment effects using machine learning. PNAS, 116(10), 4156–4165. https://doi.org/10.1073/pnas.1804597116
Murti, D. M. P., Pujianto, U., Wibawa, A. P., & Akbar, M. I. (2019). K-nearest neighbour (k-NN) based missing data imputation. 2019 5th International Conference on Science in Information Technology (ICSItech). https://doi.org/10.1109/ICSITech46713.2019.8987530
Partsch, M. V., & Goretzko, D. (2026). Detecting model misfit in structural equation modeling with machine learning–a proof of concept. Multivariate Behavioral Research, 1, 1–24. https://doi.org/10.1080/00273171.2025.2552304
Quan, Y., Tytko, T., & Hui, B. (2024). Utilizing ASReview in screening primary studies for meta-research in SLA: A step-by-step tutorial. Research Methods in Applied Linguistics, 3(1), 100101. https://doi.org/10.1016/j.rmal.2024.100101
Rooij, M. de, & Weeda, W. (2020). Cross-validation: A method every psychologist should know. Advances in Methods and Practices in Psychological Science, 3(2), 248–263. https://doi.org/10.1177/2515245919898466
Zhou, D. J., Chahal, R., Gotlib, I. H., & Liu, S. (2024). Comparison of lasso and stepwise regression in psychological data. Methodology, 20(2), 121–143. https://doi.org/10.5964/meth.11523