ECTs
1.5 ECTs are offered for course participation and final project.
Final project will be build throughout the practical sessions.
Final project consists of application of machine learning method to sample data or proprietary research data.
Agenda
- Week 1 - April 23 09:00-11:00 - MSA 3.120 - theoretical
- Week 2 - May 4 09:00 - 11:00 - MSA 3.390 - theoretical
- Week 3 - May 13 13:30 - 15:30 - MSA 3.050 - practical
- Week 4 - May 20 13:30 - 15:30 - MSA 3.120 - practical
- Week 5 - May 27 13:30 - 15:30 - MSA 3.390 - practical
Recommended reading
This book provides an overview of state of the art machine learning applications in the social sciences.
This article provides an overview of machine learning applications in social sciences discussing the most important concepts needed for users.
Practical sessions
For the practical session, we will use r and RStudio. Download and install in advance.
r = https://www.r-project.org/
RStudio = https://posit.co/downloads/
The exact r packages will be referred to during the practical sessions.
For submitting assignments, you may use GitHub or send them via E-mail. More details in class.
Assignments
Please always submit both code and a brief discussion including research question, ethics, results interpretation.
Instructors
Adrian Stanciu
Assistant professor in lifespan developmental psychology
Erik Paessler
Doctoral candidate in the department of social sciences
![]()
Philosophy of methodology
What we know and what can we enhance with machine learning.
Research follows standardized protocols aiming to observe systematic patterns in human behaviour.
The goal is to avoid as much as possible individual subjectivity, and several paradigms have been developed over the years.
Essentially all belong to the quantitative or qualitative methods.
Quantitative
Describes numeric data in view of frequencies and distributions.
Typically large samples, but limited person specific information.
Seeks causal links between predictors and outcomes.
Relies on established mathematical protocols and uses primarily theory of probabilities.
Qualitative
Explores patterns of meaning from data.
Typically small samples, but rich information from each participant.
Does not quantify information. (Rarely does so and only for data description reasons).
Facilitates in-depth exploration of behavior and reconstructs causality through biographical recollection of events.
Evidence-based narratives are created.
How would you study digital technology use among older generations in the quantitative method?
…and in the qualitative method?
Deductive research
Quantitative research follows a deductive approach to the study of human behavior.
Hypotheses are derived from theory and then tested against data.
Established criteria are evaluated to decide whether a finding is systematic or random. (Think of the p value, for instance).
Inductive research
Qualitative research follows an inductive approach to the study of human behavior.
Knowledge is generated by observing patterns of meaning from the data without imposing expectations. No hypotheses are tested.
Systematic patterns are presented using logical discourse and narratives created based on text interpretation.
Hermeneutics–science of interpretation
Both the quantitative and qualitative method rely on hermeneutics, but apply it differently.
Quantitative
A number is a proxy for a human-given value of an abstract phenomenon.
Numbers are infused with interpretation but themselves, the numbers, do not hold meaning per se.
Numbers hold the meaning given by researchers.
Qualitative
A word or a string of words carry meaning but the intended meaning is difficult to identify by someone other than the person who communicated it.
Researchers must interpret patterns of meaning in logical as well as intuitive ways.
In both cases, the data does not hold meaning per se, but it takes the meaning given by the researcher.
Researchers must exercise vigilance, be self-critical, and justify choices, as their approach and interpretations may underscore ethical, legal, and personal biases.
Beyond subjective interpretation
From statistics carried out by hand, the introduction of computers has drastically improved the computational power needed to identify patterns of systematic meaning from data.
Standards have evolved to accommodate the available data processing power.
Quantitative and qualitative methods differ in this regard.
Standards–quant
Statistical models have been developed to increase accuracy in detecting significant/ systematic associations between variables.
Much effort has been given to creating indicators for:
- Model accuracy
- Significance testing thresholds and processes
- Detecting degree of confidence of results
- Interpretability of coefficients
Limitations to this approach involve setting prior assumptions on data.
For instance, the assumption of normally distributed data needed in parameter testing.
Parameters = quantity of a statistical population that summarizes an aspect of the population, such as a mean or standard deviation.
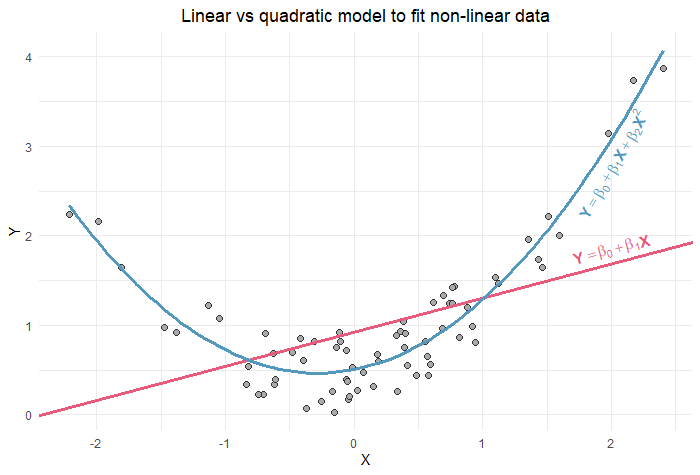
Non-linear associations such as quadratic may be modeled but require increased computational complexity in addition to loosening imposed assumption.
The increase in model complexity comes at costs of degrees of freedom and thus richer data is needed to accommodate such complexities. However, all of this leads to an exponential growth of computational processing power needed.
So, compromises had to be made: limited by computational power, assumptions must be imposed.
Standards–qual
Synthesis methods of interviews have been developed to facilitate interpretability of multiple data sources at once.
Much work has been carried out to proposing and identifying standards to
- Data synthesis
- Extracting substantive and systematic insights from self-reports
- Generating meaningful observations for theory construction
Protocols help the researcher justify their choice of meaning making from data (detect meaningful blocks of meaning needed to reconstruct studied phenomena).
1 interview with 1 person for 1 one hour will generate several pages of transcribed text. Commonly, data from 10-15 interviews are analyzed and reported in scientific journals.
Researchers with the help of software for data analysis can synthesise meaning from transcriped speech.
But, there is an upper threshold that makes it difficult to balance the identification of meaningful patterns, reduce redundancies, and ensure rapid screening over, for instance, thousands of text sources.
Multiple researchers may divide tasks between themselves but that adds complexity to ensuring reliability of findings across the coders.
So, compromises had to be made: limited by computational capacity, only ‘small’ bodies of text are analyzed.
enter Machine Learning (ML)
ML boosts data processing power. ML relies on algorithms.
ML is made possible by improvements in computational power.
ML is a form of artificial inteligence.
ML can learn from data and generalizes to unseen data without being explicitly programmed at each step in the process.
ML algorithms are developed by humans based on a set of principles of behavior: How should it act and make decisions alone.
Traditionally, a resercher wrote algorithms (used statistical software) to reduce randomness in the systematic detection of patterns of meaning.
ML challenges the researcher to write algorithms based on principles that the researcher would otherwise apply themselves.
For instance, the degree of accuracy in detecting meaningful associations between variables may be low or high and the researcher can program an ML algorithm depending on the final research goal.
The ML algorithm then applies this principle and ‘learns’ from data that is it seeks for data patterns that maximize the desired output pre-defined by the choice principle
These principles will be addressed in greater detail in the practical sessions.
ML applications in the social sciences challenges the researcher to identify rules of behaviour in their decision making processes that can be outsourced to a powerful computer.
- How should an algorithm behave if there is multicolinarity between, for example, 100 predictors?
- How should an algorithm behave if there is a non-linear association between predictors and outcomes, and if each predictor has a unique association degree (linear, quadratic, cubic, etc.) with each of the outcome, but the final and overall association predictors—outcomes is of interest to the researcher?
- How should an algorithm behave if there is no known outcome in the data, but there are over, for example, 1,000 predictors and the inter-relations between these are highly complex and un-known beforehand?
- How should an algorithm behave if there are competing hypotheses, and which hypothesis of the many is most accurate?
- How should an algorithm behave if the accuracy of findings must be strictly kept because the research has direct clinical implications? Should it be the same if the research is rather exploratory instead?
The programming of said ‘principles of machine learning behaviour’ is indeed challenging.
The choices in algorithm coding as well as the choices made at all stages that involve data collection, preparation, and interpretation must be critically and fundamentally scrutinized before ML applications per se.
The danger otherwise is biased results and thus a non-inclusive understanding of real world.
Examples include the systemic lack of data from populations with vulnerabilities such as people growing old in a foreign country, people with modest socioeconomic background, people without technology acess and limited digital skills.
Limited data
Most problematic is that the results may even miss on population specifics and thus results would reproduce a fragmented view on societal phenomena.
Limited data delay ML research applications and thus may convey the wrong impression that there are ‘no problems in specific populations’.
No data does not imply lack of issues but it implies that the problem is more fundamental. It begins at stage of data availability. Exercise vigilence!
Biases influencing algorithmic choices may be alleviated with strict rules and indicators—which will be covered at length in the practical sessions—but, ultimately, the researcher must practice vigilence and justify all choices made.
Vigilence and justifications begin at stages of developing a research question.
Researchers must consider ethical, inclusive, and critical approaches to their research that relies on ML.
The exact aspects should be clearly defined prior to applications of ML on data. And they must be informed by discipline specifics as well as larger debates on ethics and human rights.
Use genAI such as M365 Copilot
Copy-paste these prompts:
- How can I conduct a machine learning linear regression
- How can I conduct a machine learning regression with non-normally distributed data
- How can I conduct a machine learning thematic analysis
Note of caution
GenAI tools can help with algorithms, methodological explanations and standard rules of thumb.
But GenAI cannot replace human expertise and ethical reasoning.
Normal distribution is a default assumption.
Meaning finding from text is iterative.
Mind the non-sense!
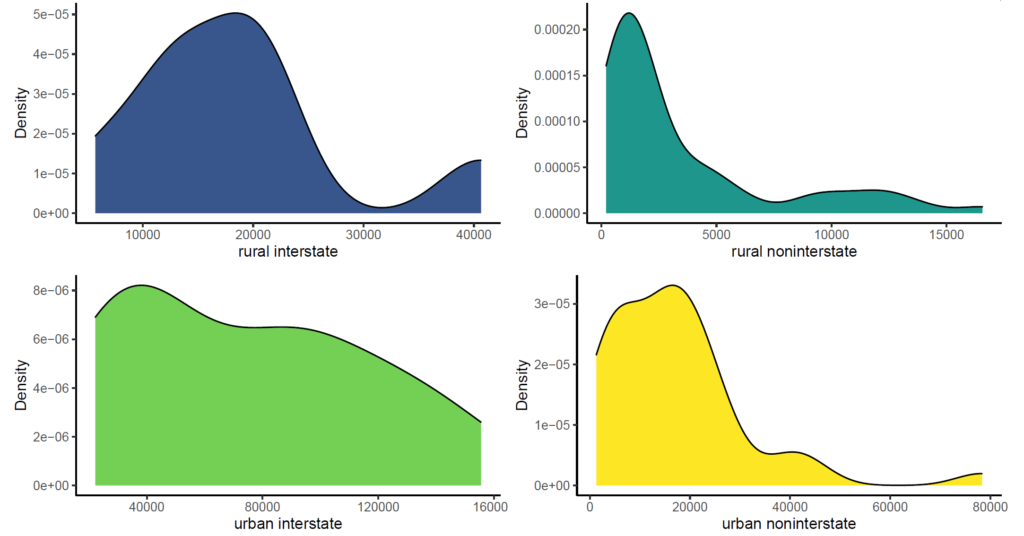
Which data is normally distributed, and which can give valid and reliable results in linear regression?
Linear associations between variables are ‘easier’ to model but they are less realistic.
Example software for qualitative data analysis: NVivo
Translation tools can reproduce bias. Source: https://www.scalablepath.com/machine-learning/bias-machine-learning
Limited data from women.
Limited data from non white, educated, industrialized, rich, democratic contexts.
For instance, results can have limited clinical relevance.
ML trained on decisions made by men with biases towards women results in biased outcomes against women.
Screen capture results prompt 3 used in M365 Copilot, 13.4.2026