Catch per Unit Effort as an Indicator of Fish Abundance in Lewis Lake, Yellowstone National Park, Wyoming
Objectives
Estimate species abundance
Calculate catch for target species
Calculate mean length for target species
Calculate Catch per unit effort (C/f) for target species
Visualize spatial distribution of C/f across four distinct quadrants within Lewis Lake
Hypothesize areas of ecological significance to Lake Trout
Background
Lewis Lake is located within the Snake River drainage at the headwaters of the Lewis River in Yellowstone National Park (YNP). It is the third-largest body of water in YNP, with a maximum depth of 32.9 m and a surface area of approximately 1,099 ha. The lake has a single major tributary flowing from the north, draining Shoshone Lake through the Lewis Channel. At its southern end, the Lewis River flows south to its confluence with the Snake River. Five fish species are currently known to inhabit Lewis Lake: Lake Trout (Salvelinus namaycush), Brown Trout (Salmo trutta), Brook Trout (Salvelinus fontinalis), Utah Chub (Gila atraria), and Redside Shiner (Richardsonius balteatus) (Lewis Lake Historical Record 1977).
Historically, Lewis Lake was fishless due to the impassable Lewis Falls. The lake was first stocked in 1890 by the U.S. Fish Commission to provide a food source for park visitors. Stocking continued until 1941, when 5,890 Lake Trout were introduced. In 1964, Utah Chub were discovered, likely introduced by anglers using live bait, along with Redside Shiner. These species now serve as prey for Lake Trout and Brown Trout. The use of live bait has since been prohibited in Lewis Lake (Lewis Lake Historical Record 1977).
Lewis Lake is a popular fishery in Yellowstone National Park due to its easy road access, motorboat launch, and nearby campground. As a result, fishery assessments have been conducted periodically since 1963. In 2019, a gillnet survey was conducted to collect Lake Trout tissue samples as part of a broader study across northwest Wyoming, which included Jackson Lake, Heart Lake, Lewis Lake, and Yellowstone Lake. Another survey was conducted in 2020 to collect Brown Trout tissue samples. These surveys provide valuable data for assessing fish populations within Lewis Lake.
Species of Lewis Lake
Lake Trout

Brown Trout

Brook Trout

Utah Chub

Methods
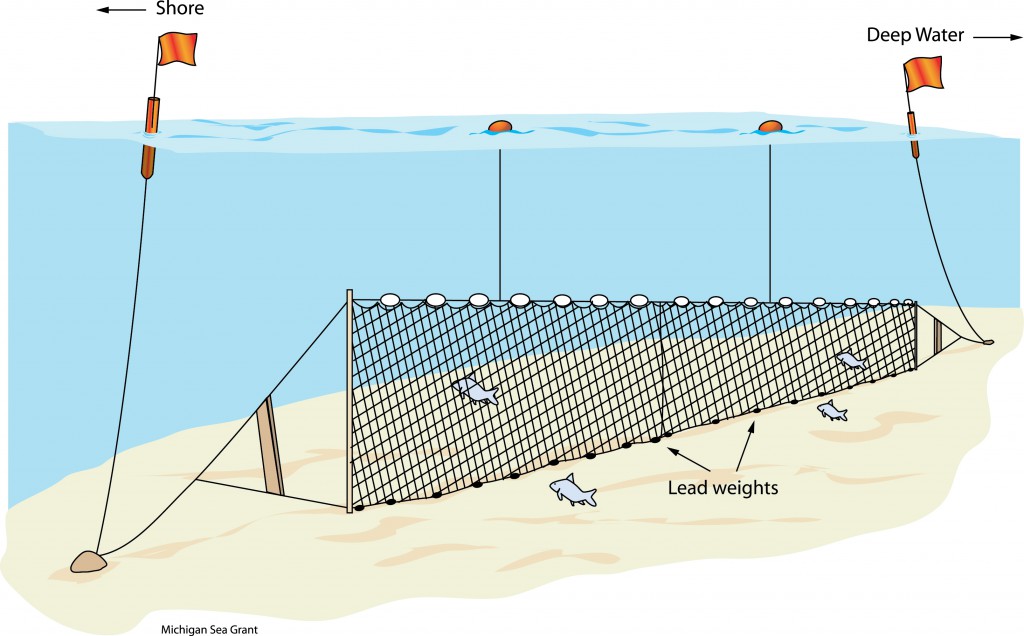
A standardized gillnet survey was conducted on Lewis Lake, Yellowstone National Park, from August 26–29, 2019, and August 24–27, 2020, by the National Park Service. Unlike Yellowstone Lake, where annual gillnetting occurs, this type of survey is uncommon on Lewis Lake. Sampling employed two experimental gillnets: one small-mesh gang (0.75–2.0 in mesh) and one large-mesh gang (2.25–3.0 in and 3.5 in mesh), with mesh sizes increasing by 0.25 in across each net (Syslo et al. 2014). Nets were set for a 24-hour soak period.
To account for summer stratification, nets were deployed across three depth strata: at the thermocline (2–10 m), through the thermocline (5–20 m), and below the thermocline (>20 m). Water temperature profiles were recorded to determine stratification timing, which typically occurs in late summer (August).
Biological data collected from each captured fish included total length, weight, sex, maturity stage, and tissue samples.

Sampling Structure
Field sampling took place in 2019 and 2020. Each year four sites were sampled, both years sites 3, 5, and 16 were sampled. In 2019 site 4 was sampled while site 20 was sampled in 2020. The northwestern portion of the lake was not heavily sampled due to being very shallow and covered in underwater dead fall. This is determinant to gillnets.

2019
2020
Combined Years (2019, 2020)
Gillnet Locations
Nets were mapped using latitude and longitude data recorded by the National Park Service.

2019
2020
Combined Years (2019, 2020)
Results
Mean Length of Species in Lewis Lake
Mean total length(mm) was plotted for each species and site with 95% confidence intervals.
2019

2020

Combined Years (2019, 2020)

Fish Catch by Site in Lewis Lake
The total number of each species captured was plotted by site.
2019

2020

Combined Years (2019, 2020)

Catch by Depth Strata
Analysis of catch by depth strata indicates that Brown Trout and Utah Chub occur almost exclusively in nets set at or through the thermocline, whereas Lake Trout are primarily captured in nets set through and below the thermocline.

Catch per unit of effort (C/f)
Catch per unit effort is a metric in fisheries science used to estimate relative abundance and density of a fish population. C/f is calculated by dividing the number of fish caught by the units of effort used to catch them. The National Park Service quantifies a unit of effort by 100m of net per hour. C/f allows us to compare fish abundance over time using standardized assessment netting protocols.

Quadrant Assignments
I assigned each site to one of four quadrants within Lewis Lake. This approach allows me to divide the lake into sections, enabling analysis of fish populations in smaller areas and comparison among quadrants to identify potential differences.
Site 4 is located on the border between the SW and SE quadrants. I assigned it to the SW quadrant to maintain sample size consistency across years.
LKT Specific C/f
In order to identify areas with the highest Lake Trout densities, I filtered the data set to include only Lake Trout and applied the same C/f calculations consistent throughout this analysis. 2019 shows wide Lake Trout distribution with hot spots appearing in a majority of nets. 2020 shows fewer hot spots but still a wide distribution. Both years show high densities along the eastern shoreline.
To assess whether non-species specific C/f differed among quadrants, I conducted a Shapiro-Wilk test and a Kruskal-Wallis test. No significant differences were detected in C/f between quadrants.

2019 Lake Trout Specific Analysis


| Test | Statistic | p.value | |
|---|---|---|---|
| W | Shapiro-Wilk | 0.782 | 0.00217 |
| Kruskal-Wallis chi-squared | Kruskal-Wallis | 5.050 | 0.16800 |
2019 Lake Trout Specific Plot


2020 Lake Trout Specific Analysis


| Test | Statistic | p.value | |
|---|---|---|---|
| W | Shapiro-Wilk | 0.825 | 0.00602 |
| Kruskal-Wallis chi-squared | Kruskal-Wallis | 0.504 | 0.91800 |
2020 Lake Trout Specific Plot


All Species C/f
I calculated C/f for all species in Lewis Lake. In 2019 high density clusters appear in the NW and NE quadrants with hot spots throughout the lake, suggesting a wide fish distribution. In 2020 fewer hot spots appear compared to the previous year. The NE quadrant appears to still have a moderate catch.
To assess whether non-species specific C/f differed among quadrants, I conducted a Shapiro-Wilk test and a Kruskal-Wallis test. No significant differences were detected in C/f bewteen quadrants.
2019 All Species Analysis


| Test | Statistic | p.value | |
|---|---|---|---|
| W | Shapiro-Wilk | 0.606 | 0.00000008694148 |
| Kruskal-Wallis chi-squared | Kruskal-Wallis | 0.750 | 0.86127450427952 |
2019 All Species Plot


2020 All Species Analysis


| Test | Statistic | p.value | |
|---|---|---|---|
| W | Shapiro-Wilk | 0.659 | 0.000000009681975 |
| Kruskal-Wallis chi-squared | Kruskal-Wallis | 0.351 | 0.950191569918547 |
2020 All Species Plot


Combined Year Comparisons
I mapped 2019 and 2020 together for both Lake Trout specific C/f and All species C/f. Lake Trout appear to be the key driver in congregation areas and appear in high densities along the eastern shore. Other species display a wider distribution across the lake.


Discussion
In 2019, a total of 784 fish were captured, and in 2020, 1,398 fish were captured during gillnet surveys on Lewis Lake. Although Brook Trout are known to occur in the lake, supported by angler-reported sightings in Volunteer Angler Records (VAR), none were captured in these surveys. This absence may be due to their tendency to congregate near tributaries, which were not included among the sampled sites, despite the sampling gear being suitable for their size.
The survey design incorporated three depth strata, allowing for species-specific patterns to emerge. Brown Trout and Utah Chub were typically captured at or through the thermocline, whereas Lake Trout were primarily caught below the thermocline. Utah Chub comprised the majority of individuals captured in both years, with the highest concentrations occurring in the northeast quadrant. This pattern aligns with their spawning behavior and preference for sand or gravel substrates, which dominate that quadrant (Graham 1961).
Lake Trout exhibited the largest mean total length among all species sampled. Utah Chub had the highest catch per unit effort (C/f), while Lake Trout C/f remained moderately consistent across quadrants. Spatial mapping indicated that the eastern shoreline of Lewis Lake had the highest concentration of Lake Trout. This area features a shallow shelf approximately 1m deep extending for about 50m, underlain by rocky cobble substrate. This is ideal spawning habitat for Lake Trout. Beyond this shelf, the lake bottom drops rapidly to depths of roughly 25m. Although Lake Trout typically inhabit deeper waters, they migrate to shallow areas during spawning season, and mapping displayed clusters of Lake Trout along the eastern shore, suggesting individuals are congregating in prime spawning habitat.
Statistical analysis revealed no significant differences in C/f among quadrants for either year, both for Lake Trout specifically and for all species combined. This lack of significance may reflect variability and the relatively small sample size, where sites with higher catch rates could represent random variation rather than true spatial patterns.
Project Extensions
The sampling procedures implemented by the National Park Service provide a strong foundation for future gillnet surveys on Lewis Lake. Expanding these efforts would allow for a larger sample size, enabling a more detailed analysis of species composition and population structure. Future surveys could include additional sampling sites to improve spatial coverage. Notably, the northwest quadrant of the lake was sparsely sampled due to submerged deadfall, which limited gillnet deployment. To address this gap, alternative methods such as rod-and-reel surveys could be employed to gather data from this area and enhance overall understanding of the lake’s fish structure.
Additional years of data collection are needed to better understand population trends in Lewis Lake. A decrease in Lake Trout catch between years does not necessarily indicate a significant decline in population size. This is because standardized gillnetting targets fixed locations rather than actively seeking fish, which can introduce variability in catch rates. If Lake Trout were specifically targeted, the number of individuals captured would likely increase, as observed in Yellowstone Lake where daily suppression netting yields higher catches compared to annual assessment netting. These differences highlight the importance of distinguishing between standardized monitoring and targeted netting when interpreting catch data.
Special Thanks
Cody Vender, National Park Service Biologist, Montana State University Fisheries Co-Operative Unit Researcher
Drew MacDonald, National Park Service Biologist, Montana State University Fisheries Co-Operative Unit Researcher
References
McCarrick, D. K., Dillon, J., High, B., & Quist, M. (2022). Spatial and temporal distribution and habitat selection of native Yellowstone Cutthroat Trout and nonnative Utah Chub. U.S. Geological Survey. https://www.usgs.gov/publications/spatial-and-temporal-distribution-and-habitat-selection-native-yellowstone-cutthroat [usgs.gov]
Syslo, J. M., Guy, C. S., Arnold, J. L., Koel, T. M., & Ertel, B. D. (2014). Standard operating procedures for distribution netting in Yellowstone Lake. Retrieved from https://www.researchgate.net/publication/339697733STANDARDOPERATINGPROCEDURESFORDISTRIBUTIONNETTINGINYELLOWSTONE_LAKE [researchgate.net]
Graham, R. J. 1961. Biology of the Utah Chub in Hebgen Lake, Montana. Transactions of the American
Fisheries Society 90:269-276.
Lewis Lake, Historical Record 1977, Yellowstone National Park. Pages 30-32.
https://fishionary.fisheries.org/wp-content/uploads/2018/06/gill-net-outline-1024x636.jpg
https://www.eekwi.org/animals/fish/lake-trout
https://www.eekwi.org/animals/fish/brown-trout
https://www.eekwi.org/animals/fish/brook-trout
https://fieldguide.mt.gov/speciesDetail.aspx?elcode=AFCJB13020