Part I
2025-11-24
Definition: Reliability is the probability that an item will perform its intended function without failure under specified conditions for a defined period of time or number of cycles.
Traditional Quality Function
Meet specifications?
Process stable?
Process capable?
Reliability Function
What will happen next and when?
Was burn-in time sufficient?
Are components failing too earlier?
Return failure rate acceptable?
Manufactured and tested → Shipping, Storage, Sale and User Application...
In real life (especially outside aerospace/military/medical), almost nobody hits a 95% lower confidence bound ≥ target by final testing alone unless they did the hard work upfront.
Where the Reliability is Actually Built? DfR→Component & material selection→Supplier & process control →Early Proto HALT/HASS/ALT.
Reliability is designed and selected in — not tested in.
| Company / Product line | MTTF Target without heroic testing | Because they invested in … |
|---|---|---|
| Dyson, Miele vacuum motors | 3000–5000 h (target 1000 h) | Over-designed brushless PM motors + early HALT |
| Apple MacBook power adapters | 1–2 million hours demonstrated (95% LCB) | 105 °C caps, huge voltage derating, Production burn-in |
| Tesla residential Powerwall | >50 000 cycles at 90% LCB | Cell-level screening + liquid cooling margins |
| Philips Hue / Signify LED drivers | B10 L70 > 50 000 h at 90% confidence | Capacitor derating rules + ripple-current limits |
Reliability Criteria (Point estimate vs. interval estimate)
| Confidence | Acceptable in consumer/commercial? | Typical decision |
|---|---|---|
| 95% | Overkill (only if marketing wants “5-nines” claim) | Nice to have |
| 90% | Still conservative, common in premium brands | Safe |
| 80–85% | Industry sweet spot for most residential & commercial products | Yes – ship |
| <75% | Very common in low-cost or high-volume segments | Ship with margin |
| Industry / Standard | Typical Success Criterion for MTTF / MTBF |
|---|---|
| Commercial avionics (DO-254) | Lower 95% (or 90%) confidence bound ≥ required MTTF |
| Space / satellite systems | Lower 95% or 97.5% bound ≥ requirement (often with success-run testing) |
| MIL-HDBK-217 / defense contracts | Demonstrated MTBF ≥ required value at 90% confidence (common) |
| FAA / EASA for critical parts | Statistical demonstration + lower bound ≥ target |
Example: Product: Repairable pump (motor).
HALT: Finds bearing fails at 90°C; safe at 80°C.
HASS: Screens at 70°C, catches 1% defective bearings.
ALT: Tests 50 motors, gives:
B10 = 7 years (target: 6 years).
R(5 years) = 95% (target: 90%).
MTTF = 50,000 hours (target: 40,000 hours).
MTBF = 45,000 hours (target: 35,000 hours).
MTTR = 1.5 hours (target: 2 hours).
Result: Pump(Motor) qualifies, supports 5-year warranty.
Tools: Use Weibull or Exponential models to analyze ALT data. Repairable Units: MTTF for first failure, MTBF for later failures, MTTR for repair time. ECN & Retest if Needed: Fix and repeat if targets are missed.
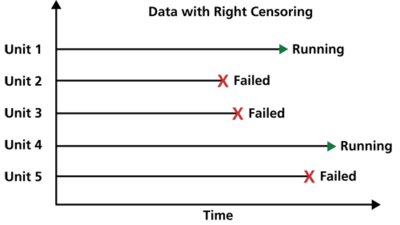
What is censored data? (Left, Interval, Right/suspended/survived/no-report)
What is UN-censored data? (failed /dead/ reported/ repaired/ replaced)
#| '!! shinylive warning !!': |
#| shinylive does not work in self-contained HTML documents.
#| Please set `embed-resources: false` in your metadata.
#| standalone: true
#| viewerHeight: 800
library(shiny)
# ===================================================================
# UI
# ===================================================================
ui <- fluidPage(
titlePanel("Weibull Theory"),
sidebarLayout(
sidebarPanel(
h4("Weibull Parameters"),
numericInput("beta", "Shape (β):", value = 1.5, min = 0.1, step = 0.1),
numericInput("eta", "Scale (η):", value = 1.0, min = 0.1, step = 0.1),
sliderInput("t", "Time t:", min = 1, max = 50, value = 1.0, step = 1)
),
mainPanel(
br(),
plotOutput("weibullPlot", height = "400px"),
fluidRow(
column(4, strong("Time t ="), textOutput("t_val", inline = TRUE)),
column(4, strong("S(t) ="), textOutput("S_val", inline = TRUE)),
column(4, strong("h(t) ="), textOutput("h_val", inline = TRUE))
),
fluidRow(
column(6, strong("MTTF ="), textOutput("mttf_val", inline = TRUE)),
column(6, strong("B10 ="), textOutput("b10_val", inline = TRUE))
)
)
)
)
# ===================================================================
# SERVER
# ===================================================================
server <- function(input, output) {
# -----------------------------------------------------------------
# Theory Calculations
# -----------------------------------------------------------------
weibull_vals <- reactive({
t <- input$t
beta <- input$beta
eta <- input$eta
S <- pweibull(t, shape = beta, scale = eta, lower.tail = FALSE)
h <- dweibull(t, shape = beta, scale = eta) / S
mttf <- eta * gamma(1 + 1/beta)
b10 <- qweibull(0.1, shape = beta, scale = eta)
list(t = t, S = S, h = h, mttf = mttf, b10 = b10)
})
output$weibullPlot <- renderPlot({
t <- input$t
beta <- input$beta
eta <- input$eta
par(mar = c(5, 4, 4, 4) + 0.3)
curve(pweibull(x, beta, eta, lower.tail = FALSE), from = 0.001, to = 50,
col = "darkgreen", lwd = 3, ylim = c(0, 1), ylab = "Survival S(t)", xlab = "Time")
par(new = TRUE)
curve((beta/eta) * (x/eta)^(beta - 1), from = 0.001, to = 50,
col = "purple", lwd = 3, axes = FALSE, xlab = "", ylab = "")
axis(4, col = "purple", col.axis = "purple")
mtext("Hazard h(t)", side = 4, line = 3, col = "purple")
abline(v = t, col = "green", lwd = 2)
grid()
legend("topright", legend = c("S(t)", "h(t)"), col = c("darkgreen", "purple"), lwd = 3, bg="white")
})
output$t_val <- renderText(sprintf("%.4f", weibull_vals()$t))
output$S_val <- renderText(sprintf("%.6f", weibull_vals()$S))
output$h_val <- renderText(sprintf("%.6f", weibull_vals()$h))
output$mttf_val <- renderText(sprintf("%.6f", weibull_vals()$mttf))
output$b10_val <- renderText(sprintf("%.6f", weibull_vals()$b10))
}
shinyApp(ui, server)SOP-ENG-04 Product Reliability SOP
SOP-ENG-04-03 Statistical tool for reliability (Sample size, Type1 calculation)
MIL-HDBK-217F (Reliaility Prediction of Electronic Equipment)
DO-254 (Design Assurance Guidance for Airborne Electronic Hardware)
Commercial software (e.g. SAS Jmp, Minitab)
Free data analysis language (e.g. Rstudio, Python)
Confidential • Quality Department 2025