Mental disorder as a network of interconnected symptoms that are activated for a long time; see Robinaugh et al. (2020)

Mental disorder as a network of interconnected symptoms that are activated for a long time; see Robinaugh et al. (2020)

  • Variables, which define the mental disorder that we examine
  • People, whose experience of a disorder we want to understand
  • Time, which can mean that the experience of a disorder differs at different moments in time

Cross-sectional networks (between people)

Depict relations between pairs of nodes (symptoms) involving many people assessed at a single point in time.

Types of networks that use cross-sectional data:

  1. Association = undirected associations
  2. Concentration (partial correlation) = eliminates spurious associations by adjusting for the influence of remaining nodes
  3. Relative importance = each edge signifies the relative importance of a node as a predictor of another node
  4. Regularized partial correlation = adjust partial correlations for the influence of the remaining nodes based on parsimony principles (our focus)
  5. Bayesian (Directed Acylic Graphs) = an ambitious method to “make believe” causality from cross-sectional data

Data structure

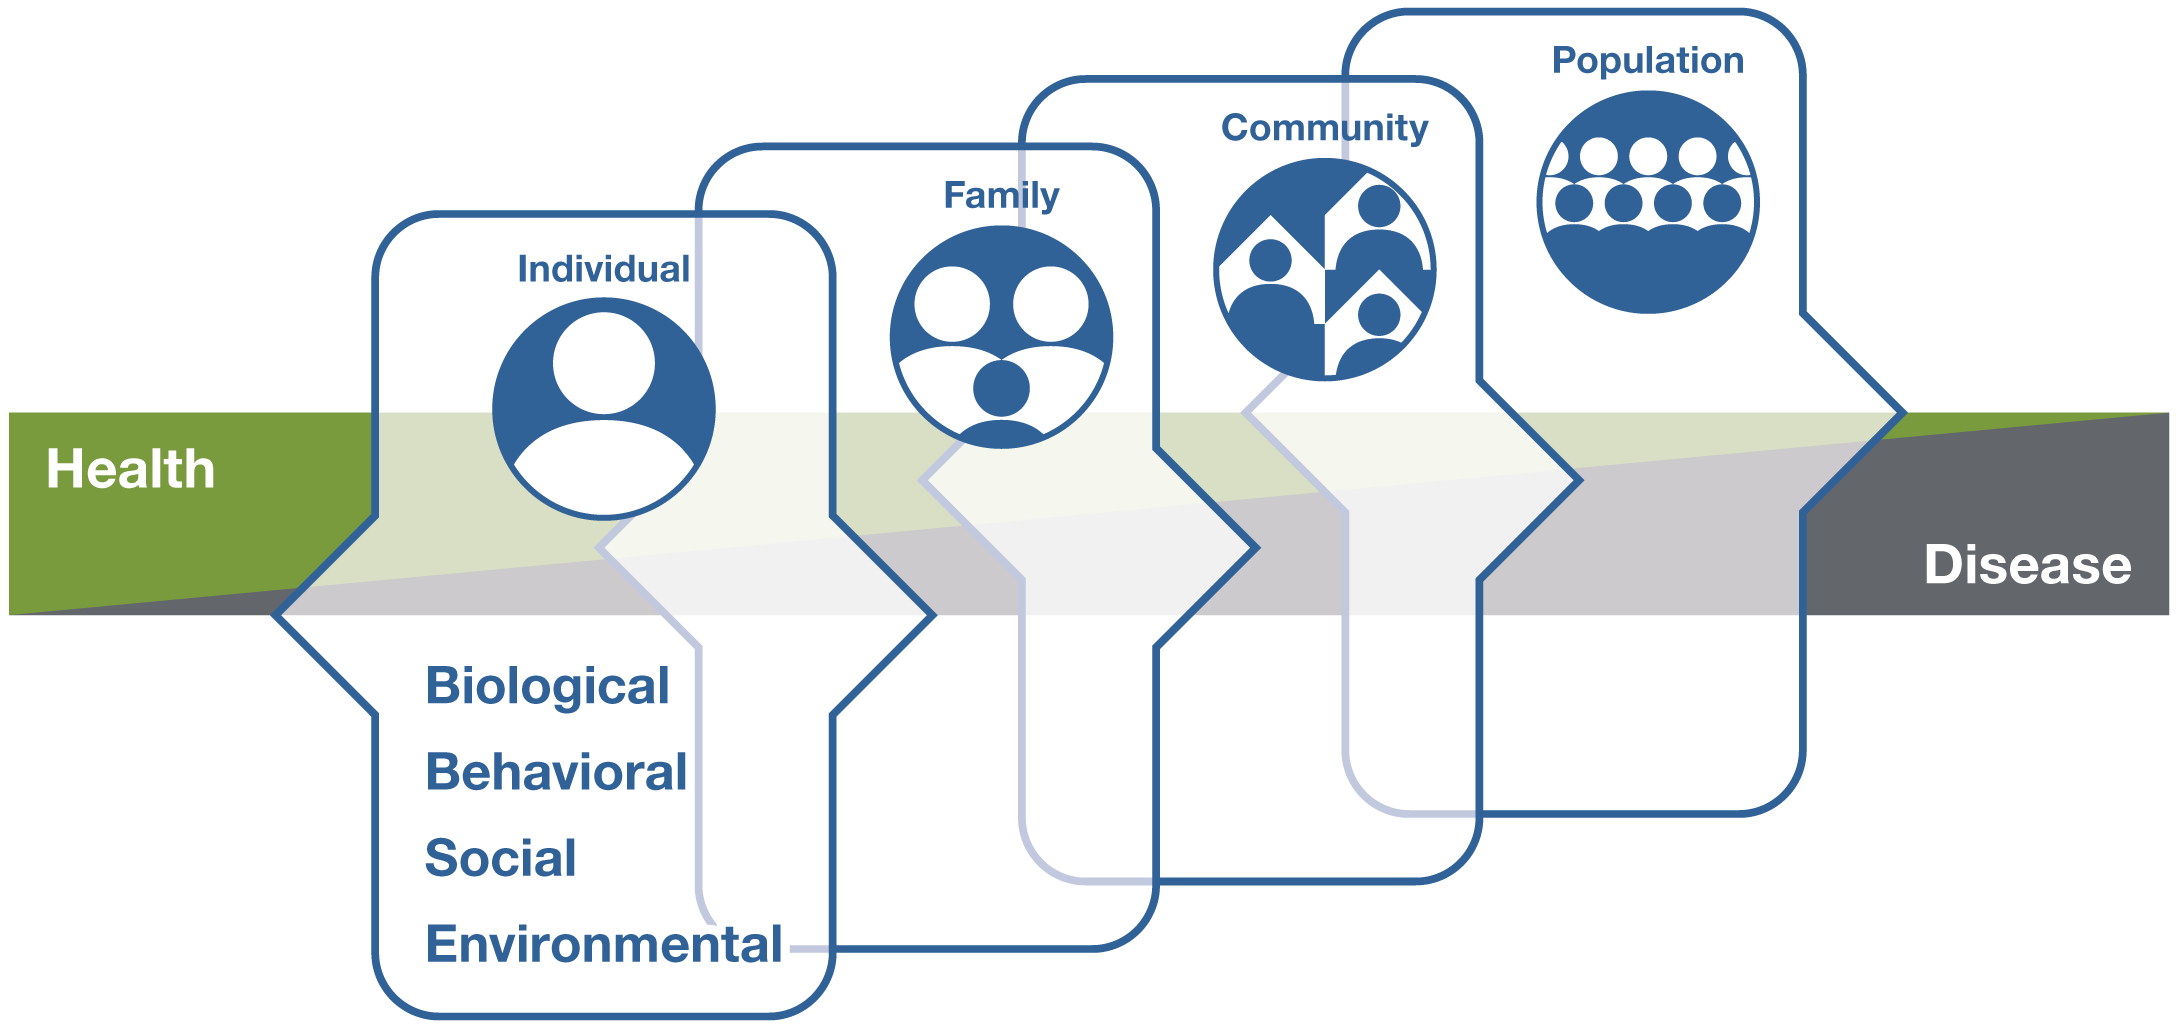
Data on individuals’ health indicators (e.g., depression).

But, we know that individuals are embedded in families, which are embedded in communities, which are embedded in a specific population.

And that an individual moves through time.

What is the likelihood that two separate communities have similar normative socialization processes?

On Patients-Doctors

Each healthcare professional may have their own specific approaches to treatment.

Each healthcare professional may have to follow the internal policies at their own clinics.

These can result in patients benefiting slightly differently from a treatment depending on who is administering it and what are available resources.

And the effects of the treatment might be different at different times.

Fixed-effects are the average effects in a group or over multiple measurement points.

Random-effects are the individual-specifics observed over time.

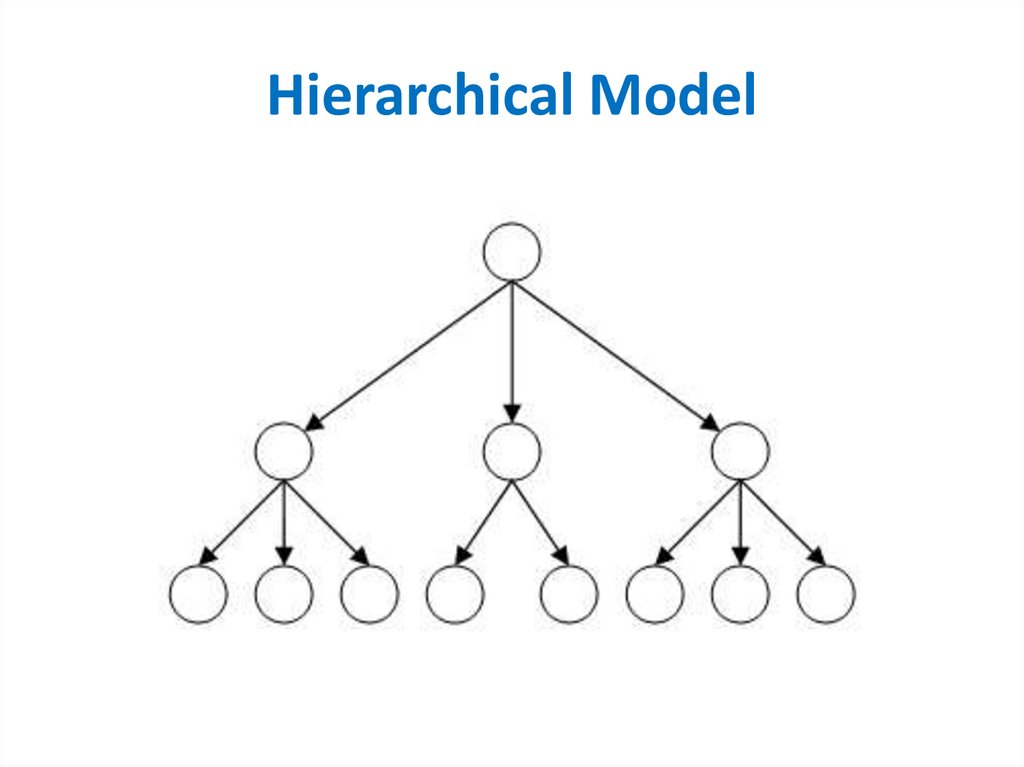
Multilevel analysis accommodates existent hierarchical dependencies in the statistical estimation of models.

Ignorning hierarchical dependencies (when present) leads to biased estimations.

Time (almost always) matter

What might explain lower productivity with increasing work hours?

Time (almost always) matter

How might time affect improvements in depressive symptoms?

Possible questions

  • What are the effects of an intervention for person X?
  • Does depression manifest differently in person X at different moments in the day?

What other questions can you think of?

See Bringmann et al. 2013, https://doi.org/10.1371/journal.pone.0060188

See Bringmann et al. 2013, https://doi.org/10.1371/journal.pone.0060188

Self-assessment of mood and social context in daily life. Assessment was done 11 times a day in university students aged M = 19.1, SD = 1.3.

  • C = cheerful
  • E = pleasant event
  • W = worry
  • S = sad
  • R = relaxed

See Bringmann et al. 2013, https://doi.org/10.1371/journal.pone.0060188

See Bringmann et al. 2013, https://doi.org/10.1371/journal.pone.0060188

Note symptom W (worry) in both cases.

There is a strong self-loop in the person on the left and a weak loop in the person on the right as signaled by the shade of green.

This means that when the person on the left worries, the person tends to worry for a longer time. Meanwhile, when the person on the right worries, the person is likely to worry for only a short time.

Three networks are computed

  • temporal depicts how variables at one time point predict variables at the next time point (directed)
  • contemporaneous depicts the edges connecting nodes at one time point (undirected)
  • between-subjects (see cross-sectional models)

Further reading Bringmann et al. (2015)

Example 1

See Bringmann et al. (2015)

See Bringmann et al. (2015)

Data from n = 182 patients with major depression (Beck Depression Inventory II) who participated in 3-20 weekly therapy sessions (average = 14 sessions). Dutch adults.

Different colors indicate node clusters that emerged from data analysis.

See Bringmann et al. (2015)

See Bringmann et al. (2015)

Green indicates cognitive symptoms.

Yellow indicates physical and affective symptoms that appear related to loss of energy and pleasure.

Example 2

Population network. Arrows represent significant symptom associations.

Population network. Arrows represent significant symptom associations.

Individual differences. Arrows represent significant inter-individual differences.

Individual differences. Arrows represent significant inter-individual differences.

University students measured 11 times a day on mood and social context. (see previous slide)

There are multiple significant positive (green lines) and negative (red lines) symptom associations as well as self-loops (symptoms predicts itself) in the population. However, there is significant variation between people with respect to some associations (blue lines), including self-loops (note missing self-loop in E “pleasant event” symptom).

Bringmann et al. 2013, https://doi.org/10.1371/journal.pone.0060188

One issue

One needs longitudinal data, which are difficult to get in practice.

Difficult because of:

  • Drop-out rates
  • Hard to reach populations (vulnerable cases)
  • A narrow time interval in the lifespan usually available (see Smallenbroek et al., 2023)

Possible questons

  • What are the long-term effects of an intervention and whether the effects are similar across people
  • Are bridge comorbid symptoms causing disorder stability in the long-run?

What other questions can you think of?

Between people

  • How are depression symptoms mapped in group X?
  • Are there group differences concerning network structure?

Note

Used to draw conclusions about a group, differences between groups or with respect to a construct or psychological phenomenon.

Within person

  • What are the effects of an intervention for person X?
  • Does depression manifest differently in person X at different moments in the day?

Note

Used to draw conclusions about changes inside a person over time.

Between-within

  • What are the long-term effects of an intervention and whether the effects are similar across people
  • Are bridge comorbid symptoms causing disorder stability in the long-run?

Note

Used to draw conclusions about changes in a group over time, about changes in a construct or phenomenon over time as well as whether the changes are group specific.

The Marburg Declaration resulted from a discussion held in Marburg, Germany in 2022. A group of clinical psychologists discussed current challenges, reviewed the evidence, and made recommendation for the future of the field.

Read the Declaration as published in Rief et al. 2024 https://doi.org/10.1016/j.cpr.2024.102417

See YouTube post https://www.youtube.com/watch?v=25U5gDRsHoQ

Rief et al. 2024; The Marburg Declaration

Rief et al. 2024; The Marburg Declaration

A call to unify methodology-driven advances and the practical sector as laid out by Kashihara et al. 2025 (Read paper https://doi.org/10.1111%2Fjpr.12538)

Observe the 5 steps proposed by Kashihara et al. 2025

Observe the 5 steps proposed by Kashihara et al. 2025

We are experiencing a historic moment in psychological treatment, literally.

1: Structure estimation

which nodes and edges to include in the model estimation?

Reminder: valid and reliable measurement instruments.

which statistical model to use?

Reminder: the 3-D data cube.

2: Description

  • What is the network structure (question of topology)?
  • What are influential nodes in the network?
  • What are differences between groups or time points?

Network topology

Data-driven

Data-driven

Theory-driven

Theory-driven

Some nodes are more strongly clustered together than with the others. Underlying commonalities.

Further reading Herdoiza-Arroyo et al. (2024), Costantini et al. (2017), Bringmann et al. (2015)

Node centrality

Strength* = absolute direct associations between symptoms

Closeness = how fast can one symptom influence and be influenced by others

Betweenness = how many times is one symptom in the path of two other symptoms

Expected influence* = positive and negative direct associations are accommodated

Absolute associations neglect the sign of the association. This may be problematic, for instance, in pathology.

Differences

  • Overall strength of associations
  • Overall node strength centrality
  • Edge strength differences

Further reading Stanciu (2024)

3: Stability analysis

  • Accuracy of edge estimation
  • Stability of network structure

Edge accuracy

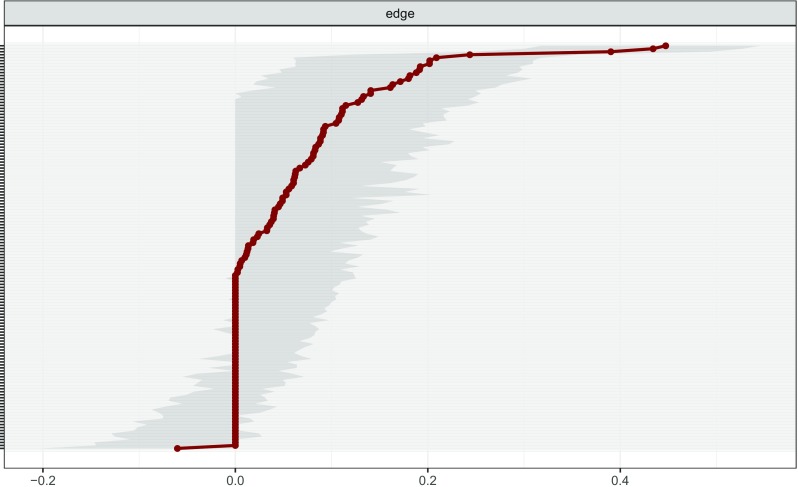
Red line indicates sample values.

Grey area indicates bootstrapped values (0 indicates statistical non-significance)

Further reading Epskamp et al. (2018)

Bootstrapping is calculating estimations from multiple random resamplings from original data.

Remember from the first session the bootstrapped confidence interval.

Network stability

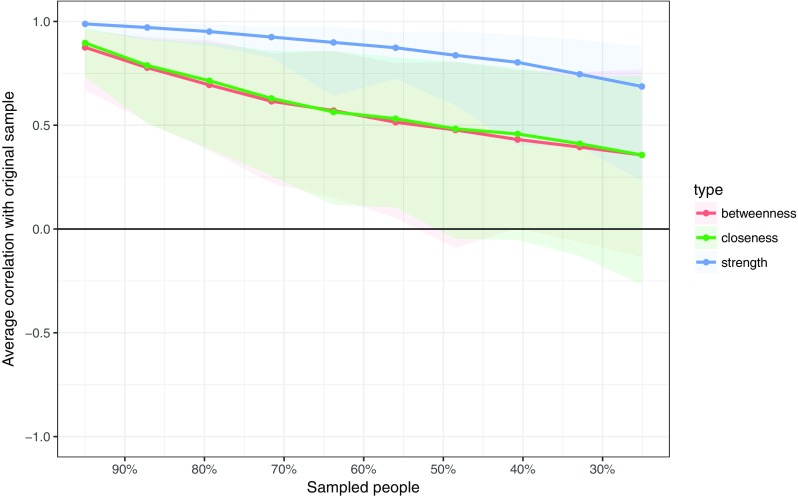
Colored lines indicate average correlations between centrality indicators estimated from data where persons were dropped and the original sample.

Colored areas indicated the range from the 2.5th quantile to the 97.5th quantile.

The CS (centrality stability) = 0.5 is the minimal threshold (estimated maximum number of cases that can be dropped from the data to retain, with 95% probability, a correlation of at least 0.70 with the original data).

Further reading Epskamp et al. (2018)

Summary

The 3-D data cube: Variables, people, time.

Cross-sectional and temporal networks.

The research question informs data collection.

Network analysis involves estimating the network structure, describing network elements, and analysing the network stability.

Accurate estimations inform accurate inferences.

References

Bringmann, L. F., Lemmens, H. J. M., Huibers, M. J. H., & Borsboom, F., D. Tuerlinckx. (2015). Revealing the dynamic network structure of the beck depression inventory-II. Psychological Medicine, 45, 747–757. https://doi.org/10.1017/S0033291714001809
Costantini, G., Richetin, J., Preti, E., Casini, E., Epskamp, S., & Perugini, M. (2017). Stability and variability of personality networks. A tutorial on recent developments in network psychometrics. Personality and Individual Differences, 136, 68–78. https://doi.org/10.1016/j.paid.2017.06.011
Epskamp, S., Borsboom, D., & Fried, E. I. (2018). Estimating psychological networks and their accuracy: A tutorial paper. Behavior Research Methods, 50, 195–212. https://doi.org/10.3758/s13428-017-0862-1
Herdoiza-Arroyo, P. E., Stanciu, A., Rosa-Gomez, A. d. l., Martinez-Arriaga, R. J., & Dominguez-Rodriguez, A. (2024). A psychological network approach to depression symptoms and sleep difficulties among adults going through grief during COVID-19: A cross-sectional study.
Robinaugh, D. J., Hoekstra, R. H. A., Toner, E. R., & Borsboom, D. (2020). The network approach to psychopathology: A review of the literature 2008–2018 and an agenda for future research. Psychological Medicine, 50(3), 353–366. https://doi.org/10.1017/S0033291719003404
Smallenbroek, O., Stanciu, A., Arant, R., & Boehnke, K. (2023). Are values stable throughout adulthood? Evidence from two german long-term panel studies. PLoS ONE, 18(11), e0289487. https://doi.org/10.1371/journal.pone.0289487
Stanciu, A. (2024). Values in psychological network systems compared across groups. In OSF Preprints. https://doi.org/10.31219/osf.io/vewf9