Psychological network systems (PNS) II
MAPI-54 2024-25
Network

Validity and reliability in real life

Interventions for mental health and wellbeing must draw on valid and accurate assessments!
PHQ-9 for depression assessment

An (incomplete) list of assessment instruments for depression from the APA:
Children and adolescents
- Behavior Assessment System for Children (BASC)
- Child Behavior Checklist (CBCL)
Older adults
- Geriatric Depression Scale (GDS)
- Life Satisfaction Index (LSR)
Chance or a fact?


How to make sure that the network estimation is stable such that edges (i.e. relationship between symptoms) is mapped together as a network that is more likely to be present in the data than a chance result?
Parsimony as a goal

Regularization technique
Such as the graphical GLASSO, to determine an optimal balance between keeping edges that are most likely zero or insignificant and maintaining a simple network for interpretation purposes.
Confidence in estimations
Confidence is how confident are we allowed to be that the found effect is the observed one.
(In)famously better known as the confidence interval.
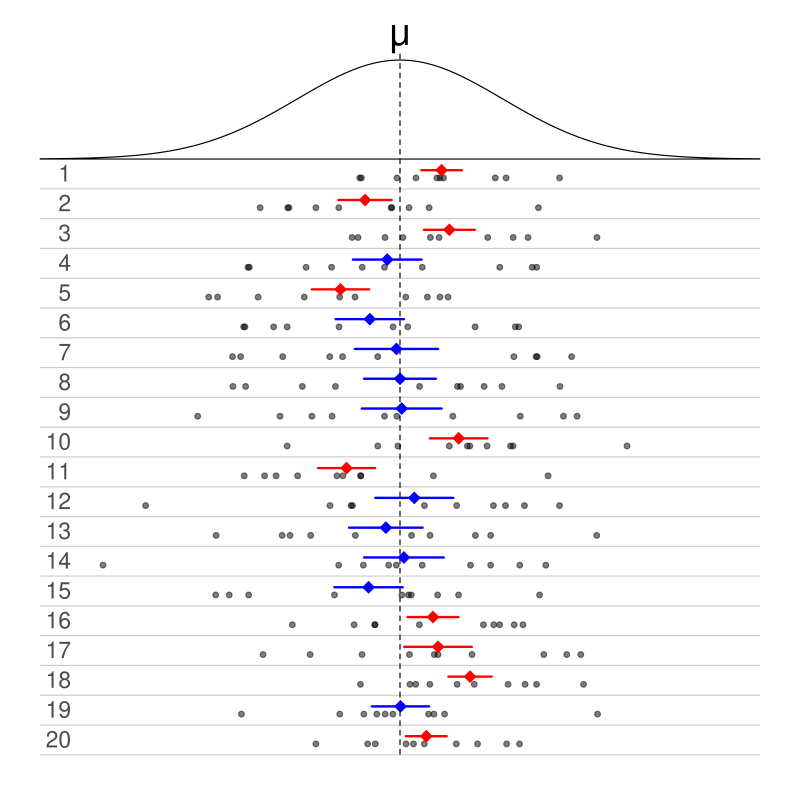
95% CI [lower bound; upper bound]
If contains 0 (zero), the result is statistically not significant and it is more likely to be a chance result.
Summary
Psychological network systems map symptoms on a network structure according to three axioms
- Interconnected symptoms directly or indirectly
- Causal dynamic relationship between symptoms
- Factors outside the system influence the system as a whole or its elements
Three methodological criteria must hold in mapping symptoms on a network system:
- Valid and reliable assessment instrument
- Stable estimated network
- Accurate estimated results

- What might we want to examine between persons? And why?
- What might we want to examine within persons? And why?
- What might we want to examine between and within persons? And why?

- What might we want to examine between persons? And why?
- What might we want to examine within persons? And why?
- What might we want to examine between and within persons? And why?
Typical research approach

PNS publications over the years


Symptoms are the network nodes.
Associations between symptoms are the network edges.
Through network analysis the nodes and edges can be systematically examined.
In systematic examinations, chance results or randomness is accounted for.
Panick attack re-visited


From theory through data to numbers and statistical models.

From theory through data to numbers and statistical models.
…philosophical yet mathematical

Cross-section
One problem with cross-sectional data is that the shape of a cross-section dictates what and how much one sees from the bigger picture.
One advantage however is that it is practical and cost effective. Fairly accurate too if limitations are acknowledged.
Association network

Network depicts PTSD symptoms in adults reporting histories of childhood sexual abuse.
Note the cloud of edges suggesting indiscrimination between what is statistically relevant and what is not.
Regularized partial correlation network

Network depicts PTSD symptoms in adult survivors of the Wenchuan, China earthquake.
Note the fewer edges suggesting that only statistically relevant edges had been mapped.
Relative importance network

Network depicts the strength of a PTSD symptom as a predictor of another PTSD symptom in adults reporting histories of childhood sexual abuse.
Directed Acylic network

Network depicts PTSD symptoms in adult survivors of the Wenchuan, China earthquake.
Comorbidity

Comorbidity is a natural consequence of partially overlapping symptomatic clusters. (Read more McNally (2021))
For example, insomnia and concentration impairment in generalized anxiety disorder (GAD) and major depressive disorder (MDD).
How to accurately assess the bridge symptoms?
Replicability

If results are not replicated in distinct cross-sectional data, does this mean that
- the method is flawed
- the phenomenon unfolds differently in different populations?
See the network stability and edge estimation accuracy (Epskamp et al., 2018).
Ontology

Seeing mental disorders as latent constructs and as resulting from dynamics of network systems are statistically exchangeable.
But it has clinical importance whether a mental disorder is the common cause of symptoms or emerges from a causal dynamic network of associations between symptoms.

For a network approach, identify those symptoms that score high on node centrality indicators.
But, can the identified highly central symptom help interventions if the data are cross-sectional?
Further reading McNally (2021)
Temporality

At least two measurement points required to test the therapeutic promise of a centrality metric.
The node centrality indicator “expected influence centrality” is a promising metric.
