ECTs and participation

No ECTs are given for participation in this seminar.

Participation is going to help in the long run because psychological network systems and analysis is a complex yet powerful tool.

It is an emergent method/ paradigm so there is plenty to discover yet.

Agenda

Theory input

  • 02.10.2025 14:00 - 17:15 @ MSA 4.030
  • 16.10.2025 14:00 - 17:15 @ MSA 4.030
  • 30.10.2025 14:00 - 17:15 @ MSA 4.030

Practical session

  • 31.11.2025 14:00 - 17:15 @ MSA 4.300
  • 27.11.2025 14:00 - 17:15 @ MSA 2.240

Please let me know in advance if you cannot make it to a class. Send me an E-MAIL.

If overlapping meetings on my side, I will inform you in advance via MOODLE.

Suggested readings

Help with understanding psychological network systems and analysis better.

  • Borsboom, D., Deserno, M.K., Rhemtulla, M., Epskamp, S., Fried, E.I., McNally, R.J., Robinaugh, D.J., Perugini, M., Dalege, J., Costantini, G., Isvoranu, A.-M., Wysocki, A.C., van Borkulo, C.D., van Bork, R., & Waldorp, L.J. (2021). Network analysis of multivariate data in psychological science. Nature Reviews, 58. https://doi.org/10.1038/s43586-021-00055-w (open access)

A comprehensive introductory paper.

  • Brandt, M.J. & Sleegers, W.W.A. (2021). Evaluating belief system networks as a theory of political belief system dynamics. Personality and Social Psychology Review, 25(2), 159-185. https://doi.org/10.1177/1088868321993751 (available via: LLC)

An example of applying psychological network systems outside abnormal psychology.

Group presentation

Group of 2-3 making sure any R expertise is balanced out.

Ideally, groups emerge organically already starting today.

Groups work on their research question, data, and create a 15 minutes presentation.

All presentations will be held during the last session. Feedback will be provided but no grading.

Create slides using PowerPoint, Quarto or any other software you feel comfortable with.

Each group may organize a consultation meeting of up to 45 minutes with me in advance.

About R and the practical session

We will analyse and visualize data using R. Data will be provided and introduced in due time.

R is a programming language used for data analysis and beyond.

For this seminar, no previous R knowledge is expected.

At UL there are several seminars on R that you might take. (See the offered courses on Moodle.)

Online resources exist too:

Depression

Let’s discuss first.

  • What is it?
  • How can we conceptualize it?
  • Does it matter what and how?
  • How is it visualized?
  • What if there was an alternative?

On systems

Figure 1: Human vascular system

Interconnected elements operate in unison according to a set of rules,

fulfilling a specific function from which

a unified whole is observable.

PNS Conceptualization

Axioms

1 - Formative elements are interconnected either directly or through a shared element

2 - There is causal relationship among the formative elements

3 - Emergent system as a whole or specific elements are influenced by exogenous factors

Re-thinking depression

Change in approach from Depression is the common cause of observed symptoms to

Specific symptoms are activated due to internal or external factors and remain activated and influence each-other resulting in depression.

Causality aka spill-over effect

A chain of spill-over positive effects in depression interventions might look like:

Feel confident > Hope > Feel in control > No suicidal thoughts > Good sleep

Factors influencing depression

What to intervene on then?

That is indeed the question!

PNS can inform about

  • the overall syptomatic mapping thus about the dynamic between symptoms,
  • highly influential symptoms thus about what symptom is most like to inform a positive spill over effect,
  • group-specifics thus what intervention approach is more likely to work in one group but not in the other.

Does annulling a trigger equal healing from depression?

Is one intervention approach applicable to long-term and episodic depression reduction?

CBT approach to depression

Cognitive Behavioral Therapy (CBT) works by identifying negative thought and emotional patterns through exploring current and past situations that may have caused them and that are no longer applicable.

CBT approach to depression

Certain symptoms may be strong in patients and thus have priority in therapy.

CBT approach to depression

But, what if certain symptoms, if adequately identified, may promote a causal chain of positive effects onto other symptoms?

What if certain symptoms are highly influential in some people but not other, and why is that the case?

One might enquire which are these symptoms, what are the overlaps with other disorders, or whether dynamics between symptoms map differently in different populations.

Network of depressive and anxiety symptoms

Overview network based on meta-results drawing on a literature review.

Network of depressive and anxiety symptoms

  • Patient Health Questionnaire (PHQ) measures depression. Inspect instrument here.
  • Generalized Anxiety Disorder (GAD-7) measures anxiety. Inspect instrument here.

Cai et al. (2024) identify PHQ2 (sad mood), GAD2 (uncontrollable worrying) and GAD3 (worry too much) as central (highly influential) symptoms. The authors discuss how this can inform targeted intervention strategies.

One terminological clarification

Psychological network systems (PNS) = Describes the shape, structure and formative elements of a psychological construct that can be visualized and mapped as a network of interconnected elements that together serves one function.

Psychological network analysis (PNA) = A method used to analyse data such that through pre-set techniques a network structure is estimated from data.

PNS is estimated from data using PNA that adheres to strict methodological protocols.

This is a psychological network

  • What are the three axioms?
  • What might the colored circles represent?
  • What stands out regarding the lines linking the circles?

The two absolute basics

Circles are the nodes of the network. These are symptoms, for example.

Lines are the edges linking two nodes in the network. These are relationships between symptoms, for example.

Edges or the relationship between symptoms are operationalized in several ways, each having its own advantages and limitations. We will address this in the next classes.

Axiom 1: Interconnection of formative elements

Our social network is most likely to be intuitive.

Our social network is most likely to be intuitive.

People in networks

1 - Direct contact (e.g. friend, parent)

2 - Contact through a shared person (e.g. that friend that keeps the group together)

Axiom 1: Interconnection of formative elements

Depressive symptoms.

Depressive symptoms.

Depressive symptoms in networks

1 - Direct contact (e.g. bad sleep and fatigue)

2 - Contact through a common symptom (e.g. bad sleep - fatigue - anxiety)

Axiom 2: Causal relation between formative elements

Your group of friends and peers are social networks that may or may not overlap.

Note

1 - Some may be more influential than other (e.g. that one friend who has strong opinions and is the leader of the pack)

2 - Some may take longer to be influenced by one other (e.g. that lone-wolf)

3 - Some my be the one to re-formulate the message so that other influence each-other (e.g. that friend that balances the group)

Axiom 2: Causal relation between formative elements

Depressive symptoms.

Depressive symptoms.

Note

1 - Depressive symptoms are all interconnected and influence each-other

2 - Some cause other (e.g. insomnia > feeling low OR feeling low > insomnia)

3 - Some are more influential than other (e.g. that symptom that influence many other)

Axiom 3: Influencing factors outside the system

Political polarization on Twitter, 2016 & 2020 elections. (see Flamino et al. (2023))

Political polarization on Twitter, 2016 & 2020 elections. (see Flamino et al. (2023))

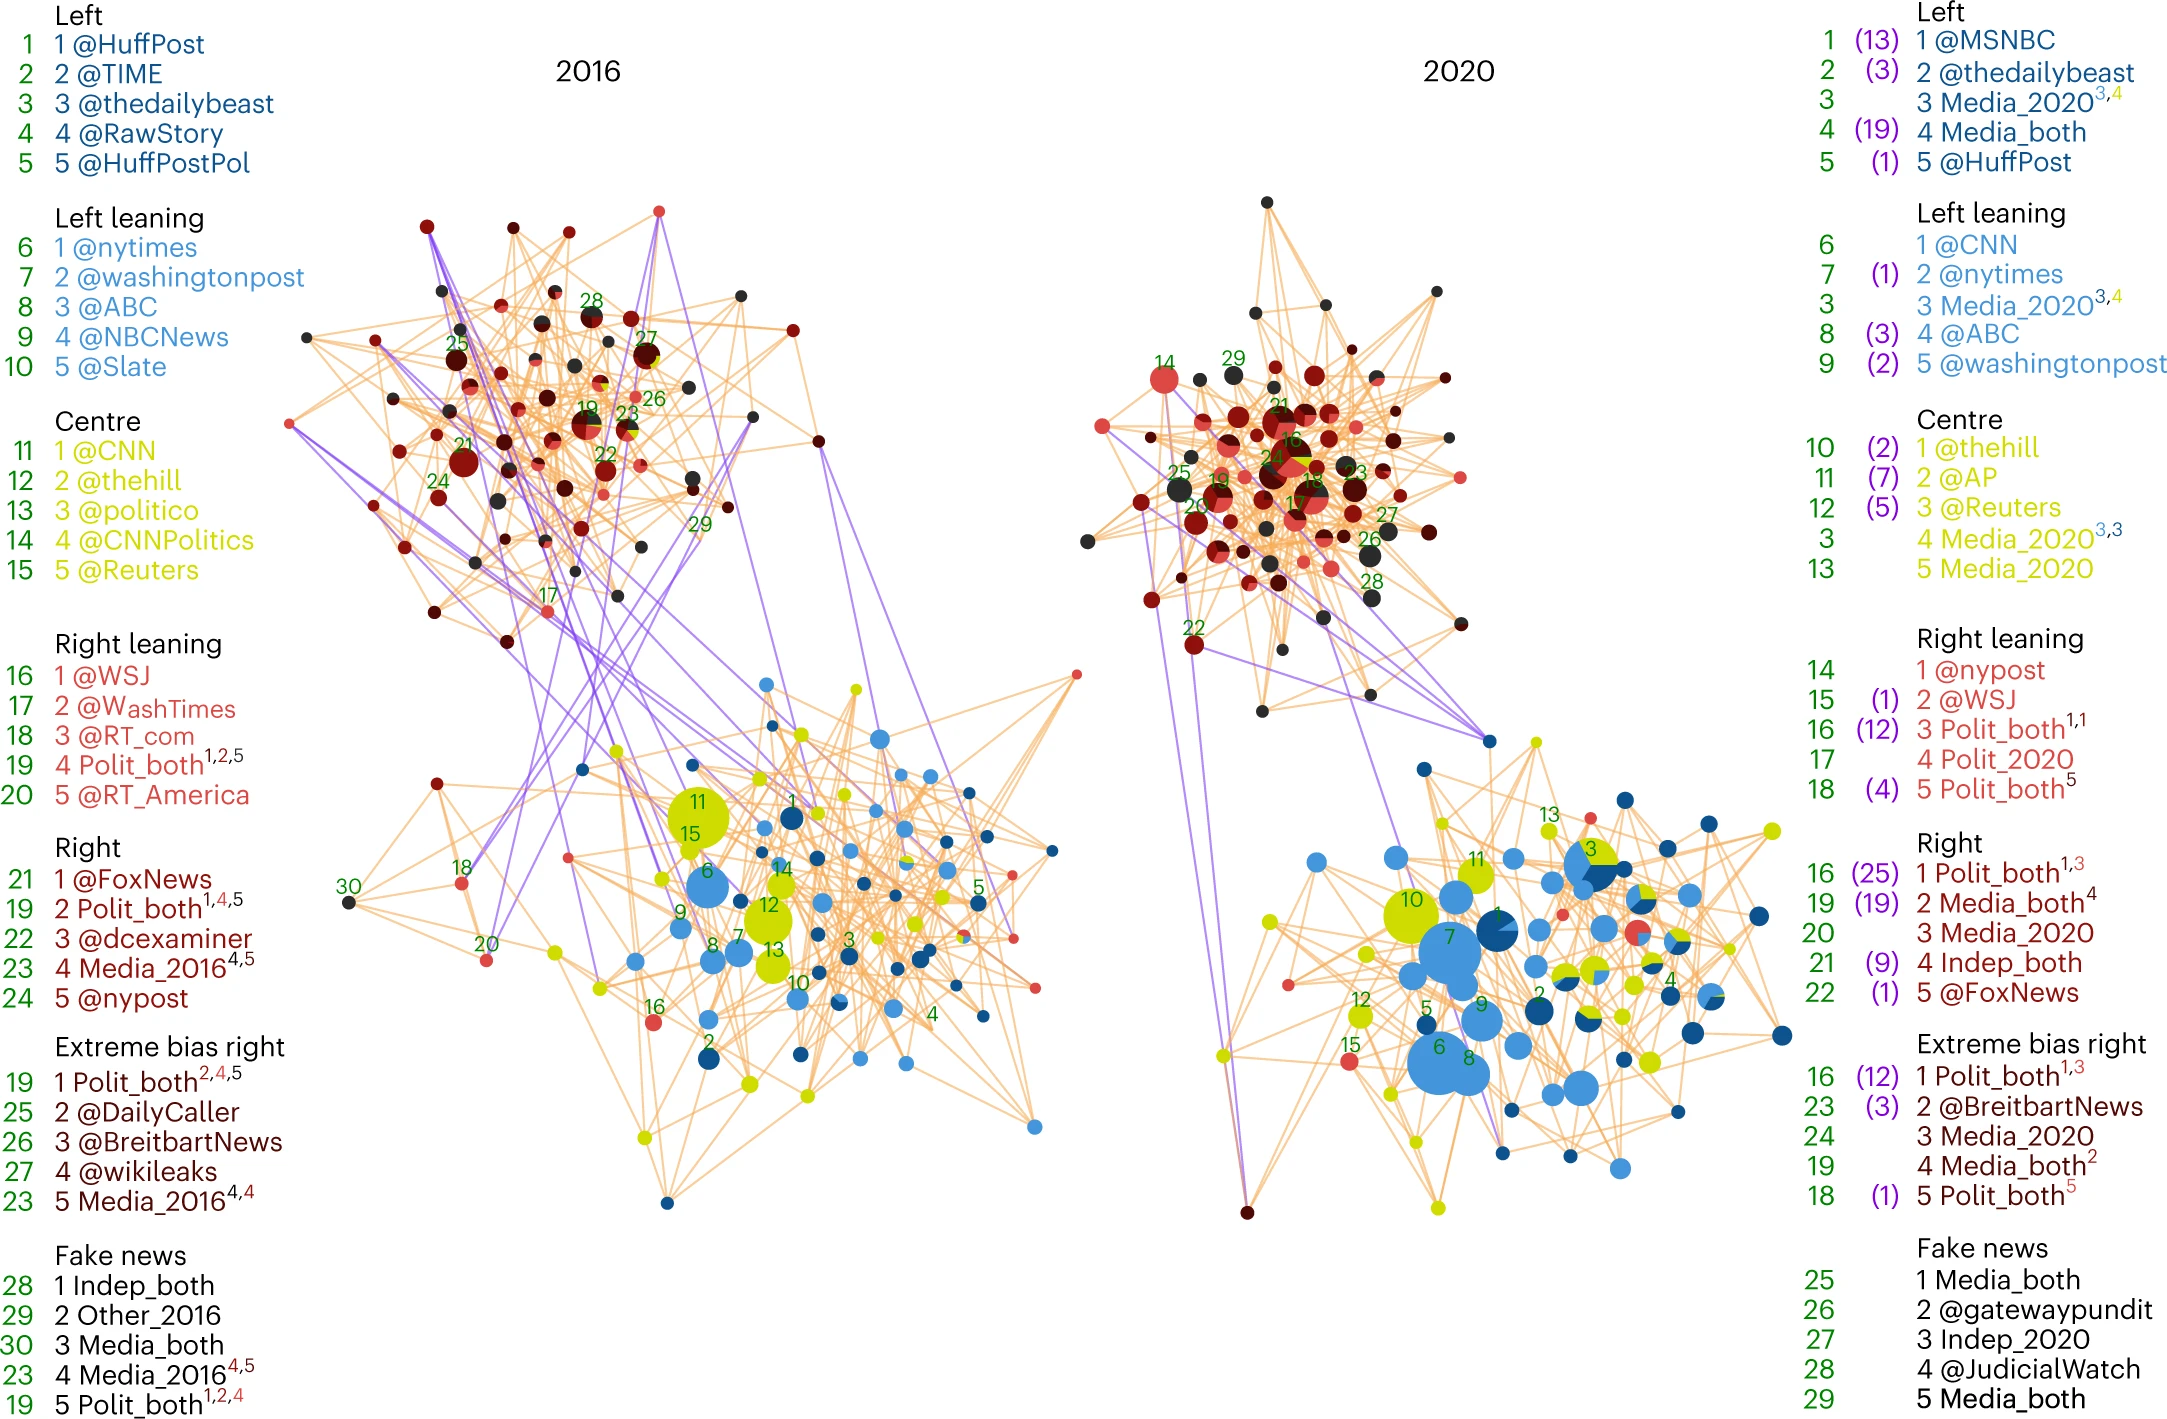
Political ideology itself, media outlets and influencers have all influenced these networks.

Axiom 3: Influencing factors outside the system

Depressive symptoms.

Depressive symptoms.

Possible factors

1 - Triggers (e.g. life events)

2 - Biological and genetical (e.g. increase in mtROS possibly indicating mitochondria (the cell powerhouse) dysfunction)

3 - Social (e.g. unhealthy work habits)

4 - …

Post Traumatic Stress Disorder?

Post Traumatic Stress Disorder?

Autism?

Autism?

Group work

Make groups of 2-3 to propose, discuss and identify influencing factors of mental dissorders that can be seen as a psychological network system.

  • Axiom 1: Interconnected elements / symptoms,
  • Axiom 2: Causal dynamics between formative elements / symptoms,
  • Axiom 3: External factors can influence the system as a whole or elements of it. Can be other systems, symptoms or traits, events, etc.

Depressive symptoms in adult women

Figure 8: A network model of major depressive symptoms in adult women (N = 2163, white women from the US). Read Moradi et al. (2022).
  • Assessment instruments must be validated
  • Estimated network must be stable
  • Influence of symptoms must be accurate
  • Possible differences across groups

What is do you think, mental health conditions are

  1. observed in manifestations of a common latent cause (symptoms)
  2. resulting from a causal interaction of symptoms

Do mental health symptoms causally sustain each other or they are related but not causally?

More research is needed but one thing is for sure:

we should remain open and accept novelty as progress in our effort to address abnormal mental health

References

Brandt, M. J., & Sleegers, W. W. A. (2021). Evaluating belief system networks as a theory of political belief system dynamics. Personality and Social Psychology Review, 25(2), 159–185. https://doi.org/10.1177/1088868321993751
Cai, H., Chen, M.-Y., Li, X.-H., Zhang, L., Su, Z., Cheung, T., Tang, Y.-L., Malgaroli, M., Jackson, T., Zhang, Q., & Xiang, Y.-T. (2024). A network model of depressive and anxiety symptoms: A statistical evaluation. Molecular Psychiatry, 29, 767–781. https://doi.org/10.1038/s41380-023-02369-5
Flamino, J., Galeazzi, A., Feldman, S., Macy, M. W., Cross, B., Zhou, Z., Serafino, A. M., M. Bovet, & Szymanski, B. K. (2023). Political polarization of news media and influencers on twitter in the 2016 and 2020 US presidential elections. Nature Human Behavior, 7, 904–916. https://doi.org/10.1038/s41562-023-01550-8
McNally, J. R. (2016). Can network analysis transform psychopathology? Behaviour Research and Therapy, 86, 95–104. https://doi.org/10.1016/j.brat.2016.06.006
Moradi, S., Falsafinejad, M. R., Delavar, A., Rezaietabar, V., Borj’ali, A., Aggen, S. H., & Kendler, K. S. (2022). Network modelling of major depressive disorder symptoms in adult women. Psychological Medicine, 53(12), 5449–5458. https://doi.org/10.1017/S0033291722002604