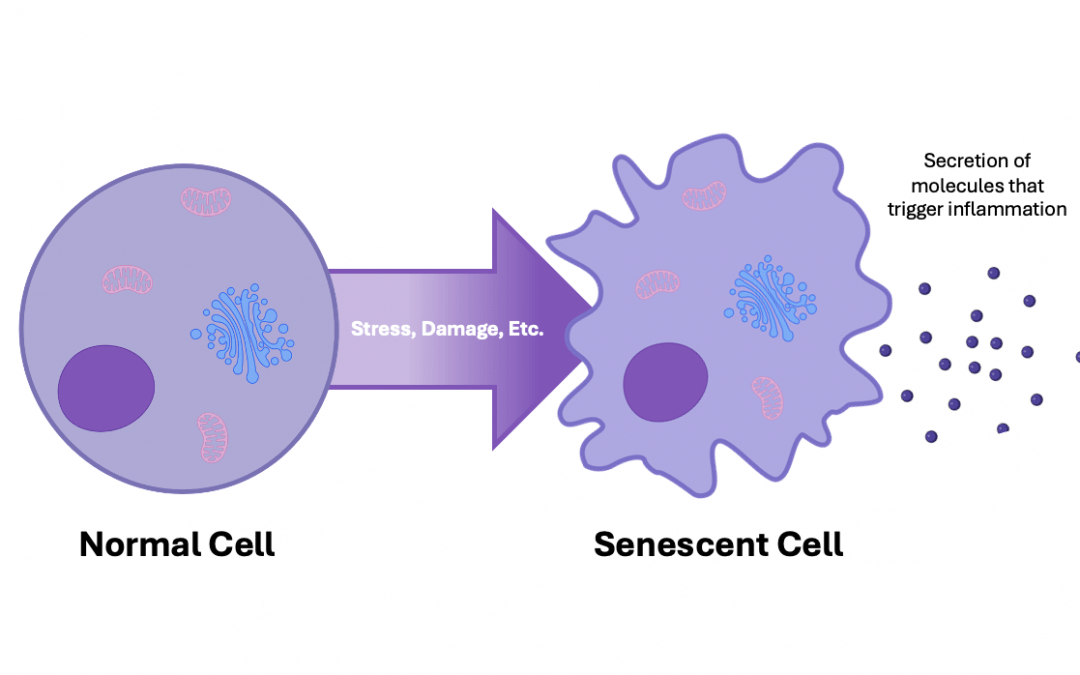
Cellular senescence is a state in which cells become arrested in the cell cycle. That is, permanently stop dividing in response to stress or damage. The term “senescence” comes from the Latin senescere, meaning “to grow old.
April 09, 2025
Cellular senescence is a state in which cells become arrested in the cell cycle. That is, permanently stop dividing in response to stress or damage. The term “senescence” comes from the Latin senescere, meaning “to grow old.
The GenAge Database contains genes potentially associated with human aging and longevity.
| Statistic | Value |
|---|---|
| Total.Genes | 307 |
| Multi.Category.Genes | 64 (20.8%) |
| Most.Common.Category | putative (53 genes) |
| Category.Count | 34 |
| Most.Connected.Gene | HSPA1A |
Statistical hypothesis testing is a framework for making decisions about populations based on sample data.
The test statistic \(t\) for comparing two means is as follows: \[t = \frac{\bar{X}_1 - \bar{X}_2}{\sqrt{\frac{s_1^2}{n_1} + \frac{s_2^2}{n_2}}}\]
Where \(\bar{X}_1, \bar{X}_2\) are sample means, \(s_1^2, s_2^2\) are sample variances, and \(n_1, n_2\) are sample sizes.
A note on P-values: \(p\)-value = \(P(T > t)\), where \(T\) is the test statistic under the null hypothesis. A small p-value (typically \(p\) < 0.05) indicates strong evidence against the null hypothesis, leading to its rejection.
Let’s get an idea of the reasons behind the inclusion of genes in the GenAge database. The dataset contains a column named why, which provides insight into the rationale for each gene’s inclusion.


The different shades of green represent distinct senescence mechanism categories, with each tile showing the relationship between a gene and its biological pathway category.
This 3D visualization plots genes using metrics derived from the GenAge database: the GenAge ID (potentially reflecting order of discovery), gene name length (often correlating with functional complexity), and the number of senescence mechanisms. This approach could reveal patterns in how complex genes participate in multiple aging pathways.
This t-test examines the distribution of GenAge IDs between cell and mammal groups, potentially revealing temporal or priority differences in how these distinct mechanisms were incorporated into the aging research database. Lower GenAge IDs typically indicate earlier database entries, which may reflect historical research priorities or discovery patterns:
| Statistic | Value |
|---|---|
| t-value | 1.5100 |
| Degrees of Freedom | 47.7000 |
| p-value | 0.1375 |
| Mean GenAge ID (Mammal) | 180.9700 |
| Mean GenAge ID (Cell) | 143.2000 |
Since our \(p\)-value is \(0.1375\), we fail to reject the null hypothesis, suggesting no significant difference in the GenAge ID distributions between mammal-associated and cell-associated senescence genes. The comparable mean GenAge IDs suggest that both mammalian model-derived genes and cellular senescence-related genes were incorporated into our understanding of aging processes at similar rates over time.
This heatmap visualizes co-occurrence patterns between senescence mechanism categories, with darker red indicating stronger associations. The matrix reveals which aging pathways frequently operate together in the same genes, highlighting the interconnected nature of senescence processes rather than isolated mechanisms. White cells identify potentially separate pathways or areas needing further research.

This code analyzes the distribution of genes in the GenAge database by their primary inclusion category, providing insight into how different senescence mechanisms are represented in the dataset.
# Analysis of gene category distribution in senescence database
ggplot(top_15, aes(x = reorder(why, count), y = count)) +
  geom_bar(stat = "identity", fill = "steelblue") +
  coord_flip() +
  labs(
    title = "Distribution of Genes by Senescence Mechanism",
    x = "Senescence Mechanism Category",
    y = "Number of Genes in GenAge Database"
  ) +
  theme_minimal() +
  theme(
    plot.title = element_text(size = 16, face = "bold", hjust = 0.5),
    axis.title = element_text(size = 14),
    axis.text.y = element_text(size = 9),
    axis.text.x = element_text(size = 10),
    panel.grid.major.y = element_blank(),
    panel.grid.minor = element_blank()
  )