Quarto enables you to weave together content and executable code into a finished document. To learn more about Quarto see Clique aqui. https://quarto.org
Tipos de ênfase e formatação
Uma palavra em negrito e uma em itálico. Você pode destacar um texto muito importante
Aqui vc pode escreve qq coisa
Que vai ficar numa caixa de de destaque
Inclusive códigos do R - mas não vão rodar
x <- 2+2
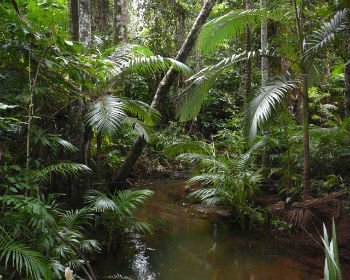
---title: "Aula Introdução Quarto"author: "Marina"date: "03 Oct 2024"cap-location: margintitle-block-banner: trueformat: htmlcode-link: truecode-tools: truetheme: mintytoc: truetoc-title: "Índice"editor: visual---# Título gigante## Título normal### Título menorzim# Inserir um linkQuarto enables you to weave together content and executable code into a finished document. To learn more about Quarto see [Clique aqui](https://quarto.org). <https://quarto.org># Tipos de ênfase e formataçãoUma palavra em **negrito** e uma em *itálico*. Você pode destacar um `texto muito importante```` Aqui vc pode escreve qq coisaQue vai ficar numa caixa de de destaqueInclusive códigos do R - mas não vão rodarx <- 2+2```## Bloco de notas> Esse vai ser meu **bloco de notas**>> Fica bonitinho## Fazer uma lista- Coisas para aprender: - Lista - R - Phyton - C++## Inserir caixas de dicas, warnings, etc.::: callout-noteEssa é uma caixa de **aviso**!:::::: callout-warningEssa é uma caixa de **ATENÇÃO**!:::::: callout-tip## Dica maravilhosaEssa é uma DICA:::# Inserir imagens{width="50%"}{width="394"} [](https://pt.wikipedia.org/wiki/Floresta_tropical_pluvial)[](https://pt.wikipedia.org/wiki/Floresta_tropical_pluvial)# Trabalhando com o R```{r}#| warning: falselibrary(tidyverse)emissions <- readr::read_csv('https://raw.githubusercontent.com/rfordatascience/tidytuesday/master/data/2024/2024-05-21/emissions.csv')head(emissions)```## Gráfico simples```{r}names(emissions)plot(emissions$total_emissions_MtCO2e~emissions$year)```## Firulagens dos gráficos```{r}#| fig-cap: "Figura 2. Emissão de Carbono por ano"#| out-width: 50%#| code-fold: trueplot(emissions$total_emissions_MtCO2e~emissions$year)```# EquaçõesPara equações no meio do texto, escevemos entre cifrões: $2\pi*r^2$Para equações destacadas:$$RE = (1- \frac{Nut_{old}}{Nut_{mat}} MLCF)*100$$# TabelaskableExtra```{r}library(kableExtra)tab <-kable(head(emissions))kable_styling(tab, full_width = F, bootstrap_options =c("striped","hover", "condensed"))```# Fazer abas::: panel-tabset## Figura```{r}#| fig-cap: "Figura 3. Entidades responsáveis pelas emissões"#| echo: falsefreq <-table(emissions$parent_entity)barplot(freq)```## Tabela```{r}#| tbl-cap: "Tabela 1. Dataset"#| echo: falsekable(head(emissions))```:::# FIM