Preparing your Paper for CaGIS
Process, R&R, Graphs and Illustrations
Eric Delmelle, Nick Bearman
2024-06-01
Workshop Objectives
- Learn about the journal
- Timeline for review, acceptance rate
- Prepare your manuscript
- research (new methodology)
- review
- essay (vision)
- Reproducibility and replicability
- High-quality maps and visuals
Overview of the CaGIS Journal
- Official publication of the Cartography and Geographic Information Society
- [‘…Society supports research, education, and practices that improve the understanding, creation, analysis, and use of maps and geographic information…’]
- [‘…journal implements the objectives of the Society…’]
- articles –> innovative research in cartography and geographic information science.
History
- 1974 : 1990: The American Cartographer
- 1990 : 1999: Cartography and Geographic Information Systems
- 1999 : now: Cartography and Geographic Information Science
- 6 issues per year, ~6-8 articles per issue: ~40 articles/year
Some statistics
![]()
Impact factor since 2015
Some statistics
![]()
Number of downloads since 2015
Some statistics
![]()
Geography of downloads since 2015
Editorial board
![]()
Process for publication
![]()
procedure for journal review
Acceptance rate
![]()
Acceptance rate
Type of papers
- research (most common)
- review
- essay/vision
The structure of your paper (research)
- Title/abstract/keywords
- Introduction: introduce the problem and motivate your paper
- why do we need this type of research
- contributions to existing work in the journal or nearby outlets
- A well explained methodology, with testable hypothesis
- New method (e.g. color scheme) –> surveys with subjects
- Discuss your results (have stakeholders been involved?)
- Future research
Testing with participants
- Typically in the US, needs to go through IRB
![]()
A study on the aptitude of color hue, value, and transparency for geographic relevance encoding in mobile maps. CaGIS 2023
The structure of your paper (review)
- Title/abstract/keywords
- Introduction: introduce the problem and motivate your paper
- why do we need this review?
- is the field moving quickly?
- is it part of a Ph.D. student first chapter?
- How is the review conducted? PubMed, Google Search?
- Future directions / call for research
The structure of your paper (review)
![]()
Example of a literature review/essay
Lines between essays and reviews are blurry
- Senior scientists or rapidly emerging scholars are likely to submit essays.
![]()
The structure of your paper (essay)
- You will need some lit. review to ground your research
- Approach could be:
- Analytical and Reflective on different perspectives, theories
- Argumentative: present or defend a particular argument or viewpoint
- Critical Evaluation: evaluate existing knowledge, identifying gaps, inconsistencies, or areas needing further research.
- Theoretical Focus: exploring conceptual frameworks and their implications.
- Directions for research
The order of authors is important
- Generally, the individual who conducted the majority of the work, should be first.
- However, in some domains (public health) the adviser goes last.
- Sandwich authors when contribution is limited
- Removing authors on R1, R2 is not a good strategy
- Author for correspondance
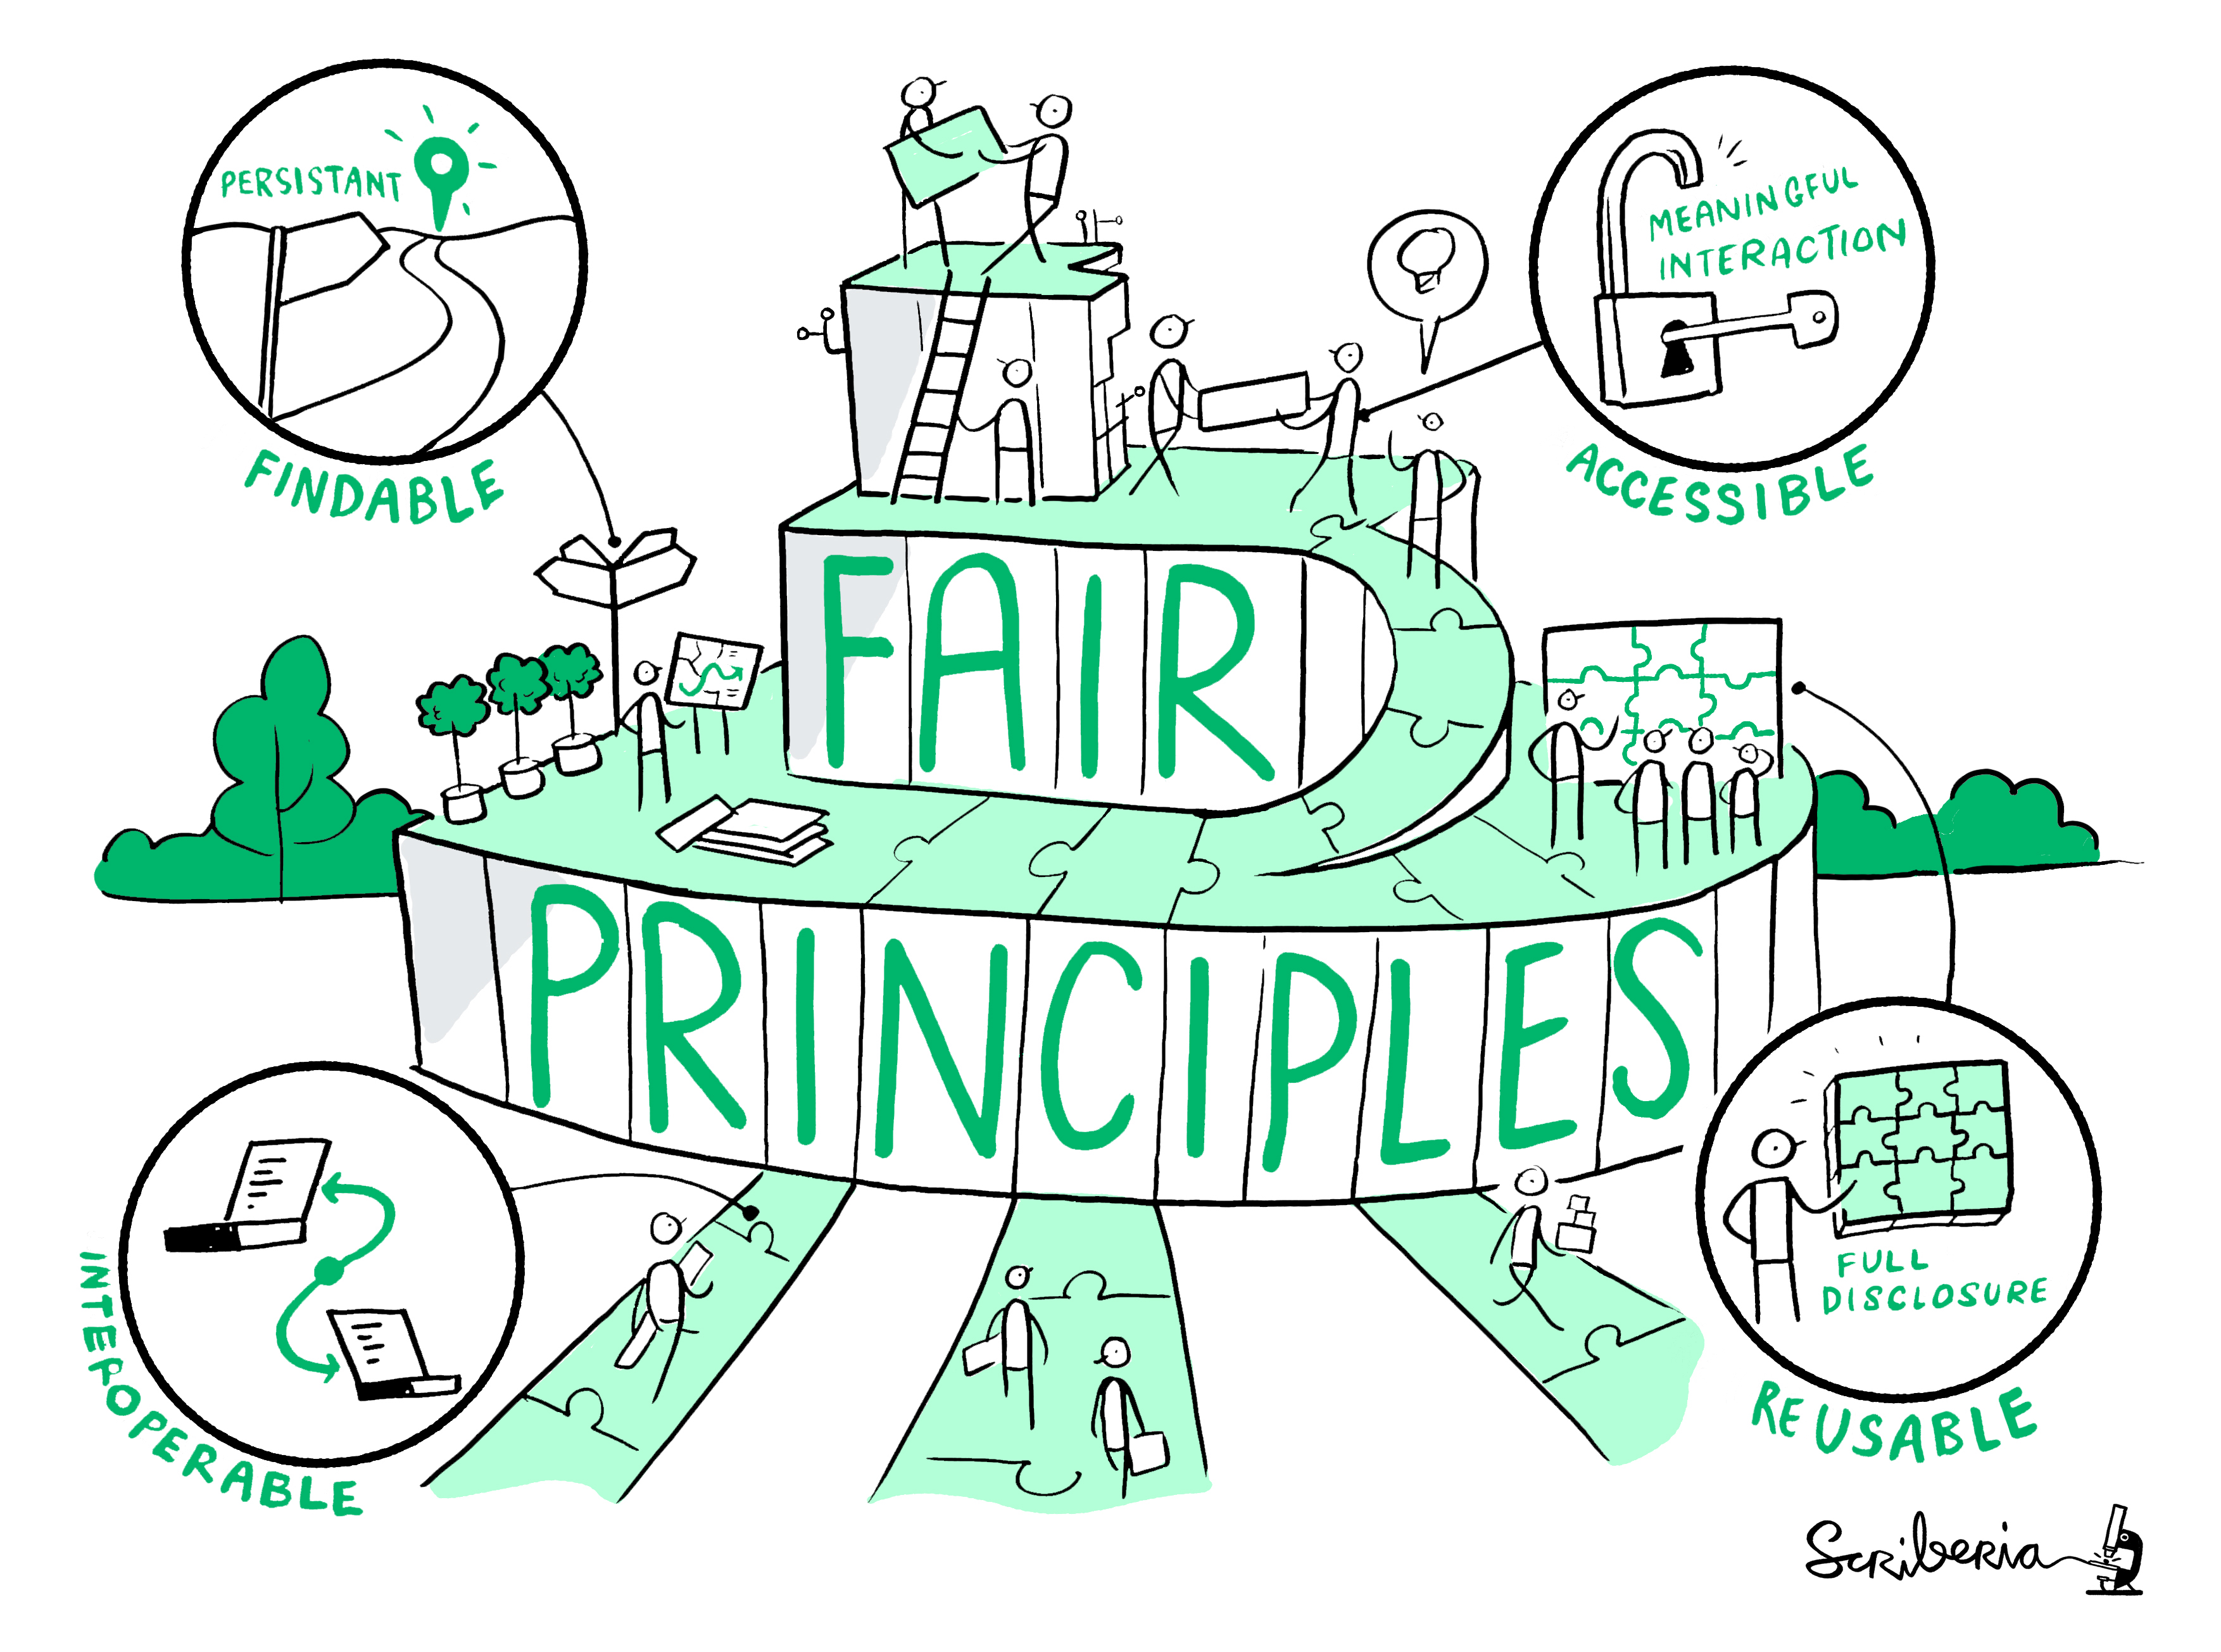
How do we make our research reproducible? - FAIR:
Findable
Accessible
Interoperable
Reusable
R&R (again)
![]()
Codes!
- Some journals & conferences ask you to submit code
- Anyone should be able to do reproduce your research and benefit from it.
- If you do analysis in ArcGIS Pro, you need ArcGIS Pro to recreate that analysis
![]()
Preparing flowcharts (1/3)
- Importance of replicability; a flowchart can really help.
![]()
Preparing flowcharts (2/3)
![]()
Preparing flowcharts (3/3)
![]()
Preparing maps (1/2)
- Figures should be in TIFF or EPS format.
- Formats such as GIF, JPEG, PDF are not acceptable
- Images produced in or embedded in PowerPoint / Word not acceptable
- Resolution must be 600 dpi.
Preparing maps (2/2)
- Multipart figures should be labelled a), b), c), etc.
- Do not embed captions within the figure
- When exporting to EPS or TIFF, all fonts should be embedded
- Myriad Pro (sans serif) font is used for figure captions
- All figures can be color (there is no additional charge for color)
Example (how to improve?) (2/2)
![]()
Maps - example of effective design (1/3)
![]()
Maps - example of effective design (2/3)
![]()
Maps - example of effective design (3/3)
![]()
Graphs: Simplify!
- Franconeri, Steven L., et al. “The science of visual data communication: What works.” Psychological Science in the public interest 22.3 (2021): 110-161.
![]()
Graphs:focus on which message?
![]()
Graphs: Scale axis
- Message will be different depending on (a) how you present your data and (b) your audience
![]()
Graphs: simplify clutter
- many package in R allow you to ‘declutter’ your data
![]()
Graphs: Be effective
![]()
Graphs: Text is your friend
![]()
Graphs: very effective
![]()
Thoughts on Colors
- Use Sparingly – don’t lose preattentive attribute.
- Use Consistently – don’t change because you are bored.
- Design with colorblind in mind – 8% of men, 0.5 % women. (red/green)
- Thoughtful of tone color conveys
Thank you!
Contact: We welcome any feedback via email. Thank you!


