2024-03-19
Electric Vehicle Charging Behavior & Usage Analysis
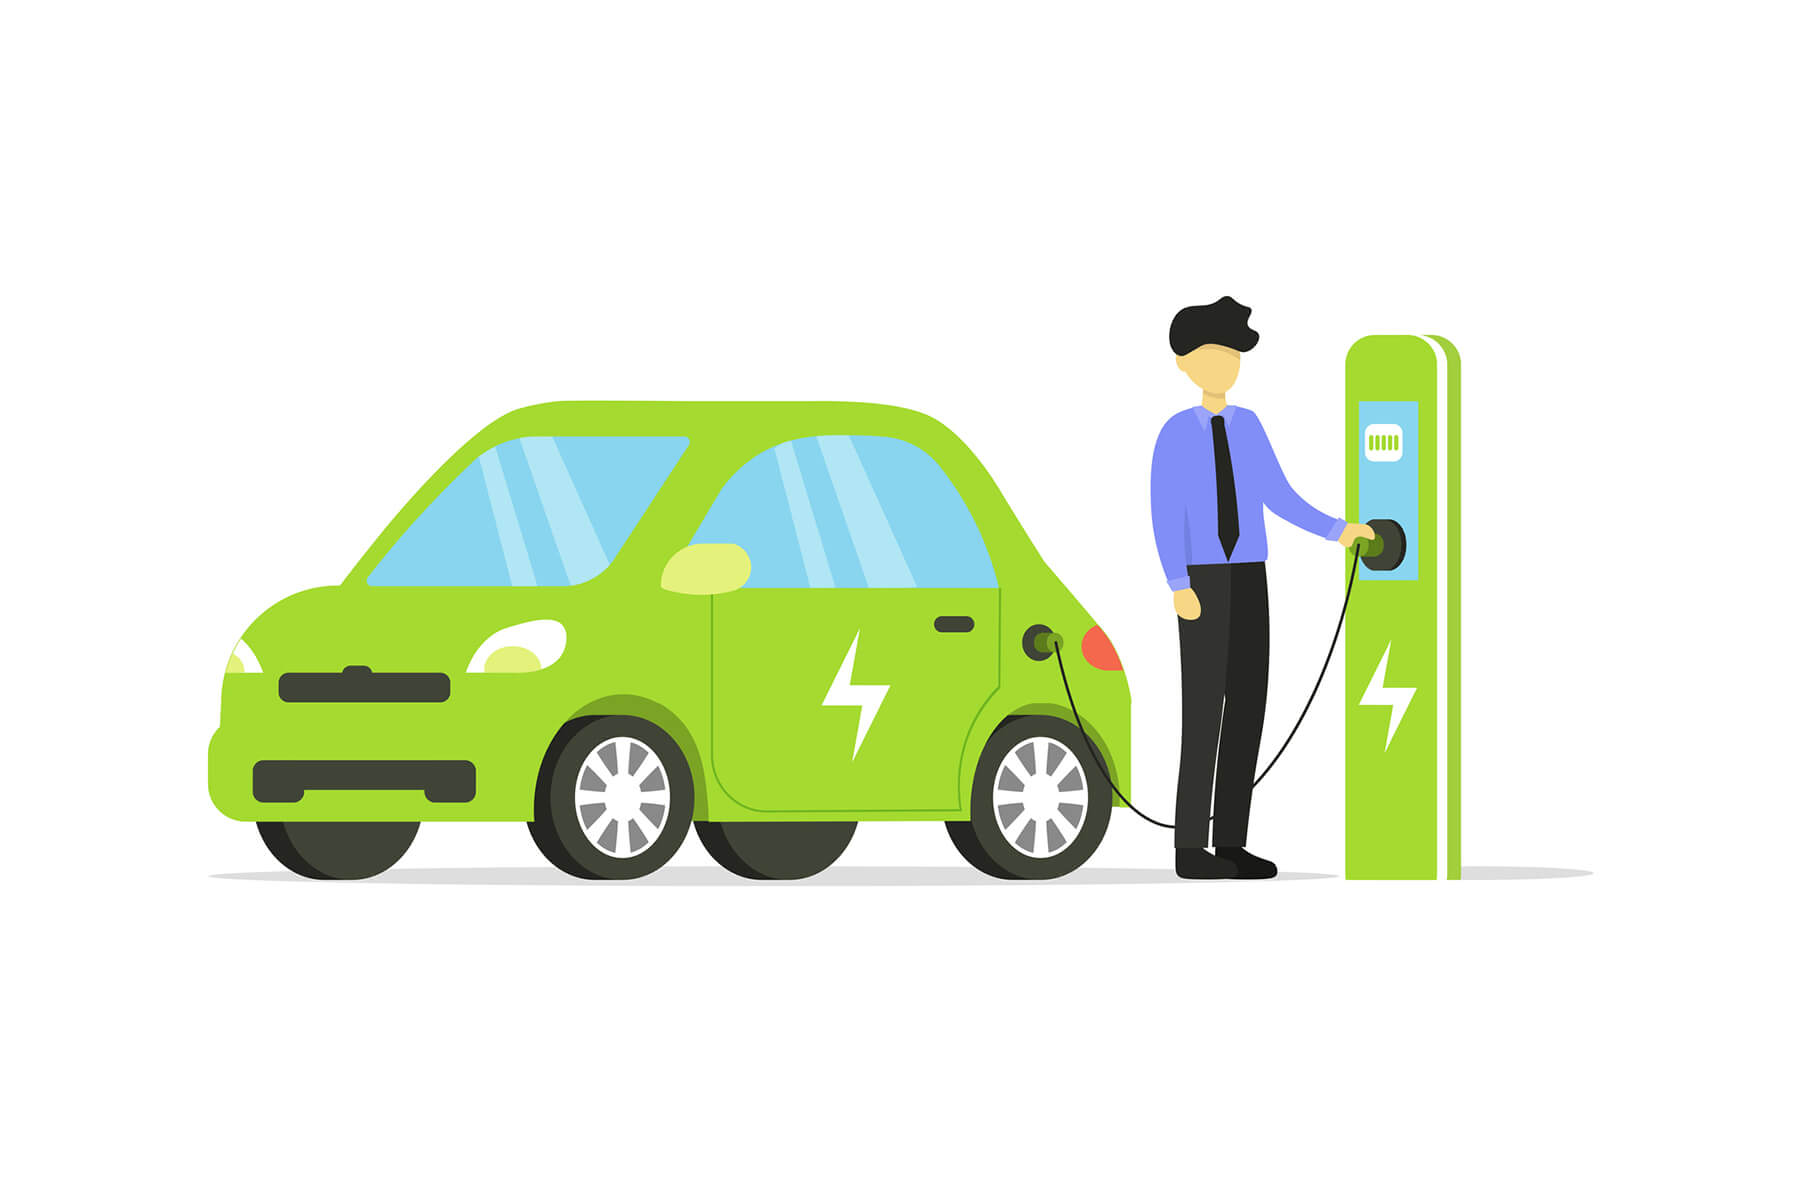
Are We Ready for Electric Vehicles?
Source Photo/Images by: https://evocharge.com/
1. Introduction:
Electric vehicles (EVs) are pivotal in combatting climate change, reducing emissions, and fossil fuel dependence. A robust EV charging infrastructure is crucial for this transition. By analyzing real-world data from 85 EV drivers across 105 stations, we aim to understand user charging behavior. Insights from Consumer Reports highlight broader benefits of EV ownership. Our goal is to inform the development of user-centric charging infrastructure to drive widespread EV adoption and societal benefits.

Source Photo/Image by: https://electrek.co/
2. Data Overview
- Comprehensive Data-set: Our analysis is powered by data encompassing the charging habits of surveyed EV drivers across various charging stations, collected over various sites. It will offer a better understanding of the dynamics of EV charging behavior.
Metrics Explored:
Energy Consumption: kWh Total per session (the energy needs of EVs).
Charging Duration: Time spent per charging session (station turnover and peak usage times).
Cost Analysis: Affordability and pricing strategies
National Average Cost vs. Survey Cost
Monthly Cost Comparison
5-Year Total Cost of Ownership and Savings
3. Energy Usage Needs
- kWh Consumption analysis that most charging sessions consume less than 10 kWh, indicating a trend towards shorter, more frequent charging sessions habits among EV drivers usage.
- Implications:
- Station Design: an increased number of stations with the ability to charge quickly vs. stations with high charging capacity.
- Location Strategy: Closer location shall be placed in areas where drivers are likely to need quick top-ups.
Visualization
df <- read.csv("station_data_dataverse.csv")

ggplot(df, aes(x = kwhTotal)) +
  geom_histogram(binwidth = 1, fill = "skyblue", color = "black") +
  labs(title = "kWh Consumption per Charging Session", x = "kWh", y = "Frequency")

Density plot shows a strong preference for charging sessions consuming less than 10 kWh.
Data Source: Bryant, Michael. "Electric Vehicle Charging Data set." Kaggle, accessed April 2023. link.
4. Duration Matters
Analyzing EV drivers’ charging duration in-depth reveals important trends in charge times that can be used to predict turnover rates and station utilization.
Charge Time Distribution:
- Frequent Short Charges: Drivers prefer to charge for only the time necessary to suit their immediate demands.
- Turnover: Requiring an increased quantity of charging stations to accommodate the high demand during peak hours.
Visualization
df <- read.csv("station_data_dataverse.csv")

ggplot(df, aes(x = chargeTimeHrs)) +
  geom_density(fill="steelblue", alpha=0.5) +
  labs(title = "Density Plot of Charging Duration", x = "Duration (Hours)", y = "Density") +
  theme_minimal()

Density plot illustrating charge time distribution (1-5 hours) with the highest concentration between 2-3 hours.
Data Source: Bryant, Michael. "Electric Vehicle Charging Data set." Kaggle, accessed April 2023. link.
5. National Average Cost vs. Survey Cost
The estimated cost per charging session based on duration and energy consumption. This helps us understand how the length of a charging session and the amount of energy consumed affect the overall charging cost for an EV.
Reference:
** For more detailed information on estimating EV charging costs, refer to the U.S. Department of Energy’s explanation on the cost to charge an electric vehicle.
Bryant, Michael. "Electric Vehicle Charging Data set." Kaggle, accessed April 2023. link.
6. Estimating EV Charging Costs
Understanding the economics of EV charging involves breaking down the costs using consumption rates and electricity prices. Here’s how we can calculate the own EV charging costs:
Cost Calculation Method:
- Determine Electricity Rate: Find the cost per kWh from electric bill.
- Estimate Monthly kWh Usage: Divide the miles drive each month by EV’s efficiency (miles per kWh).
- Calculate Monthly Cost: Multiply the estimated monthly kWh by electricity rate.
Average Cost Example**
Based on data from the U.S. Department of Energy:
- Monthly Miles: 1,124 miles (U.S. average).
- EV Efficiency: 3 miles per kWh.
- Electricity Rate: $0.16/kWh (U.S. household average).
6. Estimating EV Charging Costs Cont.
Charging Costs base on example:
- Monthly kWh Needed: \[\text{Monthly kWh} = \frac{\text{Total Monthly Miles}}{\text{Miles per kWh}}\]
- Monthly Charging Cost: \[\text{Monthly Cost} = \text{Monthly kWh} \times \text{Cost per kWh}\]
- Example Calculation: \[\text{Monthly Cost} = \frac{1,124}{3} \times 0.16 \approx \$60\]
References
** For more detailed information on estimating EV charging costs, refer to the U.S. Department of Energy’s explanation on the cost to charge an electric vehicle.
7. Economic Benefits of EV Charging
The comparison between EV charging costs and traditional gasoline expenses highlights the economic advantages of electric vehicles *.
Savings and Efficiency **
- Savings on Fuel: An average monthly electricity cost of about $60 for EV charging can result in significant savings compared to gasoline.
- Cost Efficiency: Adopting EVs reduces both the carbon footprint and monthly transportation expenses, promoting a sustainable and efficient lifestyle.
Visualization

The above comparison depict the expenses associated with electric vehicle (EV) charging in contrast to gasoline, providing a lucid juxtaposition of the possible cost reductions. The cost of gasoline shall be more double than EV charging.
** Consumer Reports (CR). "Electric Vehicle Ownership Costs" Consumer Reports (CR), accessed April 2023. link.
*/** U.S. Department of Energy. the U.S. Department of Energy’s explanation on the cost to charge an electric vehicle. link.
8. Broader Benefits of EV Adoption
The transition to electric vehicles (EVs) is not just an individual choice but a collective step towards significant environmental and economic improvements.
Environmental Impact
- Reduced Emissions: EVs dramatically decrease the carbon footprint compared to gasoline vehicles, essential for combating climate change.
- Sustainable Energy: When paired with renewable energy sources, EVs offer a pathway to a zero-emission future.
Economic Advantages
- Cost Savings: EV owners can save between $6,000 and $10,000 ** over the life of the vehicle, thanks to lower fuel and maintenance costs.
- Depreciation: EVs depreciate at a rate comparable to internal combustion engine vehicles when adjusted for federal incentives, ensuring value retention.
8. Broader Benefits of EV Adoption Cont.
Ownership Cost Analysis
Consumer Reports’ 2021 study highlights that for six out of nine EV models analyzed, the total ownership costs were lower than their gasoline counterparts in the first five years.
This is attributed to: 50% savings on repair and maintenance. About 60% savings on fuel costs, assuming average driving habits and primarily home charging **.

9. Cost Analysis Over 5 Years: EV vs. Gasoline Vehicle
Detailed calculations can reveal the significant cost savings you may achieve over 5 years by choosing an Electric Vehicle (EV) over a gasoline vehicle.
Assumptions for Calculations
Example based on references information below.
- Annual Mileage: 12,000 miles
- Electricity Cost: $0.23 per kWh
- Gasoline Cost: $3.40 per gallon
- EV Efficiency: 4 miles per kWh
- Gasoline Vehicle Efficiency: 25 mpg
- Annual Maintenance Costs: EV - $300, Gasoline Vehicle - $500
Calculation
Annual Electricity Usage for EV: \[\text{Annual kWh} = \frac{\text{Annual Mileage}}{\text{EV Efficiency}} = \frac{12,000}{4} = 3,000 \text{ kWh}\]
Annual Fuel Usage for Gasoline Vehicle: \[\text{Annual Gallons} = \frac{\text{Annual Mileage}}{\text{Gasoline Vehicle Efficiency}} = \frac{12,000}{25} = 480 \text{ gallons}\]
Annual Electricity Cost for EV: \[\text{Annual Electricity Cost} = \text{Annual kWh} \times \text{Electricity Cost} = 3,000 \times 0.23 = \$690\]
Annual Gasoline Cost for Gasoline Vehicle: \[\text{Annual Gasoline Cost} = \text{Annual Gallons} \times \text{Gasoline Cost} = 480 \times 3.40 = \$1,632\]
Calculation Cont.
Total 5-Year Ownership Cost (Fuel + Maintenance):
EV: \[\text{Total EV Cost} = (5 \times \$690) + (5 \times \$300) = \$3,450 + \$1,500 = \$4,950\]
Gasoline Vehicle: \[\text{Total Gasoline Vehicle Cost} = (5 \times \$1,632) + (5 \times \$500) = \$8,160 + \$2,500 = \$10,660\]
Total Savings with EV
Savings Over 5 Years: \[\text{Savings} = \text{Total Gasoline Vehicle Cost} - \text{Total EV Cost} = \$10,660 - \$4,950 = \$5,710\]
The substantial savings EV owners can enjoy over a 5-year period, primarily due to lower fuel and maintenance costs which saved $ 5,710 over 5 years.
Summary

Source Photo/Image by: researchgate.net/
Electric cars (EVs) can save drivers an amount of money compared to gas powered vehicles because of lower fuel and upkeep expenses.
Our research indicates that EV owners could potentially save, than $5,700 in a 5 year span when factoring in electricity and gas prices.
Choosing an EV not only leads to financial advantages for consumers but also plays a crucial role, in protecting the environment by reducing carbon emissions.
As electric vehicle technology and infrastructure continue to advance the perks of owning an EV are expected to become more appealing.
References
- Bryant, Michael. "Electric Vehicle Charging Data set." Kaggle, accessed April 2023. Electric Vehicle Charging Dataset.
- Consumer Reports (CR). "Electric Vehicle Ownership Costs." Consumer Reports, accessed April 2023. EV Ownership Costs.
- U.S. Department of Energy. "The Cost to Charge an Electric Vehicle," accessed April 2023. Cost to Charge an EV.
- EnergySage. "What is the Average Electricity Rate in the U.S.?" February 2023. Average Electricity Rate in the U.S..
- Progressive. "What is Good Mileage for a Used Car?" Good Mileage for a Used Car.
- Forbes Advisor. "Gas Prices by State." Gas Prices by State.
- NADA. "Beyond Sticker Price: Cost of Ownership for EVs vs. ICE Vehicles." Cost of Ownership for EVs vs. ICE Vehicles.
- The Zebra. "What Are the Average Car Repair Costs?" Average Car Repair Costs.