
We R together
R Club
石长顺
WISE XMU
What is R
Definition
R is a free software programming language and software environment for statistical computing and graphics.
this is a video R_intro
R History
- S 语言是 R 语言的前身.
- S语言是由AT&T贝尔实验室的John Chambers1980年发明。
- 1998 年美国计算机学会(ACM)授予了S语言的主要设计者 Chambers“软件系统奖”。
- R 语言诞生新西兰。
- 1993年, Ross Ihaka 和 Robert Gentleman发明了R.
- 1995年6月, R语言GPL协议下作为开源软件发布了。
- 1997 年,R 核心团队成立.
- 2011 年至今,R 核心团队成员数目达到 20 位。
What is R?
Data analysis software
Programming language
Environment for statistical analysis
Open-source software project under GNU.
Community
Why R

1. R is open-source
- Free: No worries about subscription fees, license managers, or user limits.
- open: You can inspect the code and tinker with it as much as you like.

2. R is fashional.
R is very popular statistical programming language and platform to perform data mining, analysis, and visualization.

2. R is fashional.(CONT'D)

2. R is fashional.(CONT'D)
High popularity often means easier communication between you and other users because you "speak" the same language.
3. A friendly statistical analysis toolkit.
All of the standard data analysis tools are built right into the R language:
Accessing data in various formats.(
.txt,.csv,.xlsx,.dta... )traditional and modern statistical models(
regression,ANOVA,GLM,tree models,timeseriesetc)
fit <- lm(weight ~ height, data=women)
summary(fit)
##
## Call:
## lm(formula = weight ~ height, data = women)
##
## Residuals:
##     Min      1Q  Median      3Q     Max
## -1.7333 -1.1333 -0.3833  0.7417  3.1167
##
## Coefficients:
##              Estimate Std. Error t value Pr(>|t|)
## (Intercept) -87.51667    5.93694  -14.74 1.71e-09 ***
## height        3.45000    0.09114   37.85 1.09e-14 ***
## ---
## Signif. codes:  0 '***' 0.001 '**' 0.01 '*' 0.05 '.' 0.1 ' ' 1
##
## Residual standard error: 1.525 on 13 degrees of freedom
## Multiple R-squared:  0.991,  Adjusted R-squared:  0.9903
## F-statistic:  1433 on 1 and 13 DF,  p-value: 1.091e-14
par(mfrow=c(2,2))
plot(fit)

4. Graphics and data visualization.
Visualizations act as a campfire around which we gather to tell stories.(Al Shalloway)
Basic Plot

ggplot2
package {ggplot2}

Interactive Graphic
package {googleVis}
there another video
5. Versatile

Finance
package {quandmod}
library(quantmod)
getSymbols("USD/CNY",src="oanda",from="2015-01-01")
chartSeries(USDCNY, theme = "white")

Finance(Con't)
package {PerformanceAnalytics}
library(PerformanceAnalytics)
data("edhec")
charts.PerformanceSummary(edhec[,c(9,12)])

Text mining
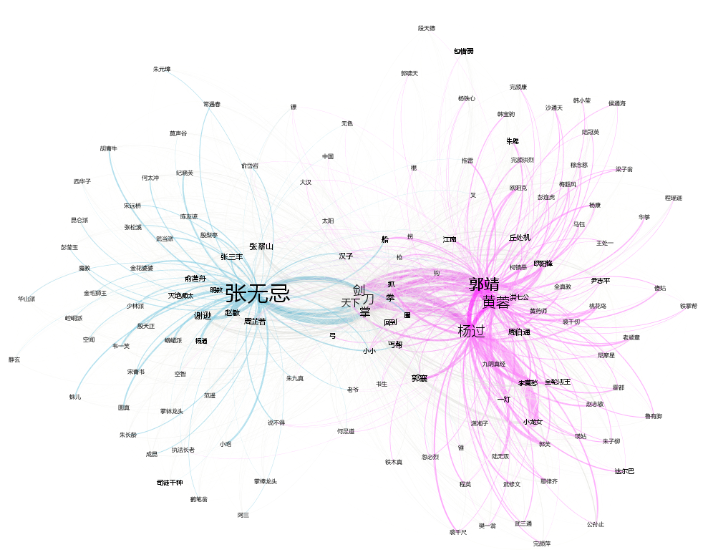
Social Analysis

6. Rich resources & vibrant community
R has a huge, rapidly increasing amount of online resources and vibrant community.
- 7,264 packages in almost all data-related areas(untill Oct. 4th, 2015)
- 108,508 stackoverflow questions tagged by
r(untill Oct. 4th, 2015) - R core, R developers , R Users from a wide range of backgrounds like statistics, econometrics, finance, bioinfomatics, mechanical engineering, physics, medicine...
- 中国R语言会议
- Other website: Also there are a lot of websites specialized in R like R-bloggers, and Rdocumentation.
7. High Paid
