Analysis of FEMA NFIP Claims Paid 1990-2023
don fernandes
2024-02-28

Synopsis
This data set provides details on FEMA National Flood Insurance Program, (NFIP), claims transactions. It is derived from the NFIP system of record, staged in the NFIP reporting platform and redacted to protect policy holder personally identifiable information. We examine only FEMA flood claim data in this analysis. Payments are grouped by decade: 1990, 2000, 2010, and 2020. It will be shown that single weather events occuring in a single year represent a significant percentage of total claims for the entire sampled decade. We will also show that over a 33 year period, (1990-2023), three states received a significant percentage of overall claim payments as compared to the remainder of the country.
2020-2023 NFIP Claims Paid
By State - $Millions

In 2022 Hurricane Ian struck Florida representing 52% of total claims payed in this decade.
2010-2019 NFIP Claims Paid
By State - $Millions

In 2017 Hurricane Harvey struck Texas representing 28% of total claims payed in this decade.
2000-2009 NFIP Claims Paid
By State - $Millions

In 2005 Hurricane Katrina struck Louisiana representing 47% of total claims payed in this decade.
1990-1999 NFIP Claims Paid
By State - $Millions
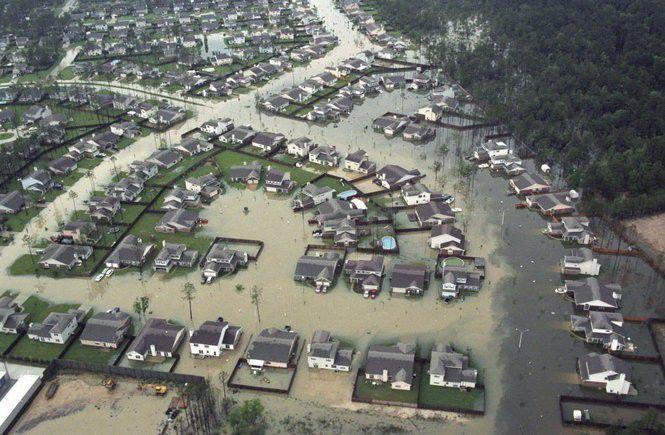
In May 1995, Louisiana received 27.5" of rain in a 40 hour period resulting in catastrophic flooding representing 9% of total claims payed in this decade.
1990-2023 NFIP Claims Paid
By State - $Millions

Between 1990-2023, Louisiana, Texas, and Florida received 35% of total NFIP claim payments distributed in the United States.
Source Material
FEMA NFIP Dataset: {NFIP_Claims}
Satellite Hurricane Images: {NASA Images}"
Louisiana Flood Image: {May 1995 Flood}"