Another day, another map. R's raison d'être is primarily to allow users to rapidly visualise and analyse data. It's a Swiss army knife, like perl: more useful than it is stylish. In a way I've been misusing the language, by creating complex scripts to visualise large data sets. One project I've got on the back-burner involves generating and plotting over 10Gb of eigenvalues without dependencies in R, on a 32-bit OS; something R is horrible at.
So for a change of pace, I'm going to visualise some data using the kind of hack that R is so good at.[1]
l <- base::length

library(ggplot2)
library(rjson)

### accessToken <- '' get an accessToken here:
### http://developers.facebook.com/docs/reference/api/.  Navitage to
### objects with location, open the associated link, and copy the text in
### the url following 'access_token='
The functional programming paradigm can useful for writing succinct, less bug-prone code. It also lets your write powerful one-liners by using first-class functions, as in the code below. The getFacebookData() function performs two tasks; getting and formatting your Facebook friends list, and getting and cleaning their geotags (which are associated with photos and other objects).
In the interest of privacy, I won't attach any names or identifiers to the location data in my example plot. That would be unfair to people with private accounts. If you wish to use the code, The locationData is saved as a list of individual users geotags, in case you wish to colour-code or name users yourself.
There are two data formatting functions nested within the getFacebookData() function;the correct version is assigned based on the type of query being made to Facebook. These functions tidy the rJSON object made from the returned Facebook data (I could have used field parameters in the query, but that would be less interesting).
getFacebookData = function(name = "ryangrannell", accessToken = NULL,
    type = "friends", id = NULL) {

    if (type == "friends") {

        cleanData <- function(x) {
            return(unlist(x)[2 * (1:(0.5 * l(unlist(x))))])
        }

    } else {

        name <- id

        cleanData <- function(x) {

            return(rbind(sapply(unlist(x)[which(names(unlist(x)) == "data.place.location.longitude")],
                as.numeric), sapply(unlist(x)[which(names(unlist(x)) == "data.place.location.latitude")],
                as.numeric)))
        }
    }

    return(unname(cleanData(fromJSON(file = paste("https://graph.facebook.com/",
        name, "/", type, "?access_token=", accessToken, sep = "")))))

}
Here I shorten the code required to get the friend ids and locations by assigning the Facebook friend data within the specifications for the loop, and by using default parameters. Within the body of the loop I find the locations associated with each id, and save it to a list.
I also included an if statement to make sure that there is actually are some long/lat coordinates associated with the ID: NULL-proofing code is more difficult than just excluding empty objects from the data early in play.
locationData <- list()

for (i in (count <- 1):l(friendList <- getFacebookData(accessToken = accessToken))) {

    if (l(temp <- getFacebookData(name = "ryangrannell", accessToken = accessToken,
        type = "locations", id = friendList[i])) > 0)
        locationData[[(count <- count + 1)]] <- matrix(temp[, !is.null(temp[1,
            ])], nrow = 2)

}
## Error: object 'accessToken' not found
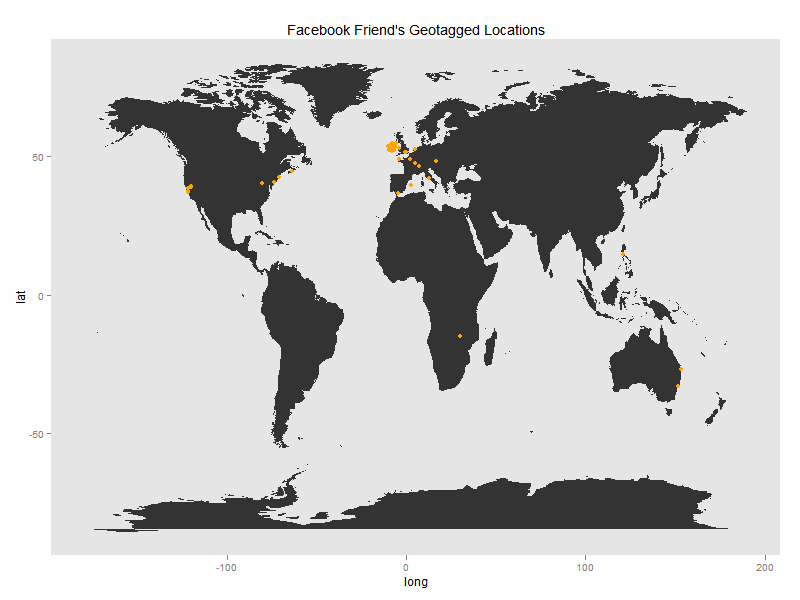
Now, onto plotting. Creating a great graphic takes days; creating a functional graphic takes a few seconds using ggplot(). The concept of aestetic mapping helps a lot to this end; the idea is that you just specify a visual element (colour, size, position…) and set it to be a function of some part of your data.
The plotting function is an nice example of a lambda expression; a function that is not bound to an identifier. To call lambda expressions in R you simply add the parameters in the usual parentheses-encoded style after the function definition. This function doesn't even return a useful value (its purpose is to generate a graphic as a side-effect), so the output doesn't need to assigned a name either.
(function(locationsData) {

    plotData <- ggplot(legend = FALSE) + geom_polygon(data = map_data("world"),
        aes(x = long, y = lat, group = group))

    for (i in 2:l(locationData)) {

        plotData <- plotData + geom_point(data = data.frame(x = locationData[[i]][1,
            ], y = locationData[[i]][2, ]), aes(x, y), colour = "orange") +
            opts(title = "Facebook Friend's Geotagged Locations", panel.grid.major = theme_blank(),
                panel.grid.minor = theme_blank())
    }

    print(plotData)

})(locationData)
## Error: subscript out of bounds
All this code (the R markdown document included) was written in two hours, at a pretty relaxed pace.[2]
[1] in that spirit, please ignore the warnings this code generates; the directly downloaded data from facebook isn't entirely a JSON object, so rjson throws a fit when it comes across the problematic lines. The output should be fine
[2] I started the project while cooking a roast dinner, and finished just before I tucked into the steak. The meal was a little overcooked…