
September 1, 2015
PAH Monitoring Sites
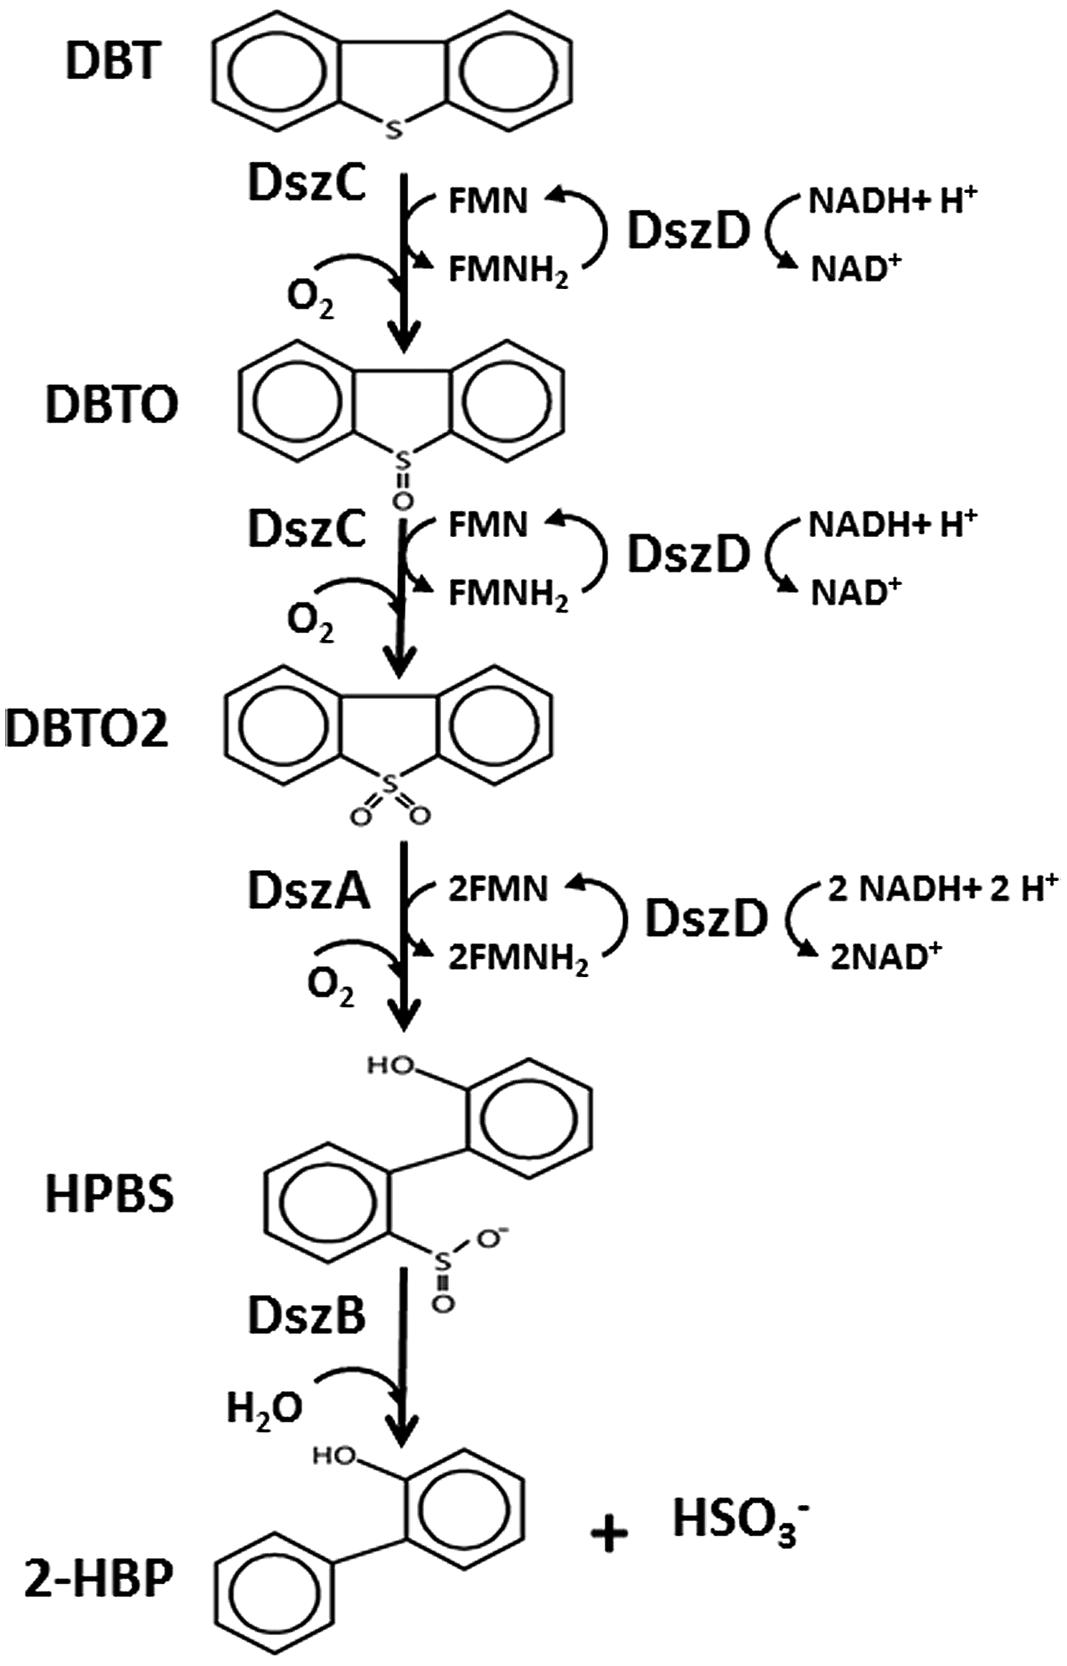
Desulfurization of Diesel Fuel
Question
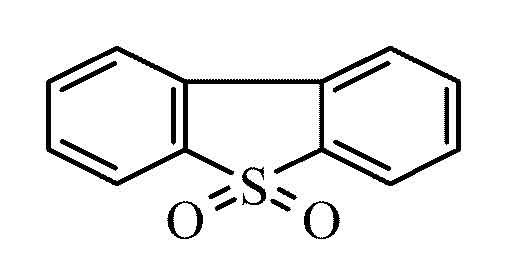
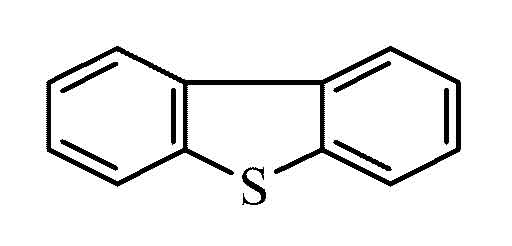
Is Dibenzothiophene Sulfone (DBTS) generated on the XAD from Dibenzothiphene (DBT) or is there an air emissions source?
There are two types of samples in the PAH Study: Active and Passive. First the active sample results were evaluated.
First Test: Are these Two Pollutants Associated with Eachother
Active DBT and DBTS Plot and Non-Parametric Correlation Analysis

## [1] "NonParametric Correlation Coefficient Using Kendall Tau Pairwise Comparison = 0.71"
What happens if we control for temperature?
## [1] "NonParametric Partial Correlation Coefficient Using Kendall Tau Pairwise Comparison"
##   estimate p.value
## 1     0.64   <0.01
How much of the Variability of DBT can be Explained by the Variation in DBTS
##    Parameters DBT_DBTS_Results
## 1 X-Intercept        -3.16e-03
## 2       Slope         2.02e-01
## 3     p value         5.66e-08
## 4   r squared         5.00e-01
Again, what if we control for temperature?
##    Parameters DBT_DBTS_Temperature_Results
## 1 X-Intercept                    -3.16e-03
## 2       Slope                     2.02e-01
## 3     p value                     6.99e-08
## 4   r squared                     5.07e-01
Now test ratios of DBT and DBTs to test if they are
constant
change with temperature
are different by site
Are the Results different by Site?
-Both DBT and DBTS are different by Site for active samples
## [1] "DBT Result Differences Test"
##
##  Kruskal-Wallis rank sum test
##
## data:  Result by as.factor(Monitor_ID)
## Kruskal-Wallis chi-squared = 55.8, df = 2, p-value = 7.574e-13
## [1] "DBTS Result Differences Test"
##
##  Kruskal-Wallis rank sum test
##
## data:  Result by as.factor(Monitor_ID)
## Kruskal-Wallis chi-squared = 21.9, df = 2, p-value = 1.788e-05
DBT and DBTS by Site

Are the Ratios (DBT/DBTS) different by Site?
-No, ratios are not statistically different by site.
## [1] "DBTS Result Differences Test"
##
##  Kruskal-Wallis rank sum test
##
## data:  Ratio by as.factor(Monitor_ID)
## Kruskal-Wallis chi-squared = 0.314, df = 2, p-value = 0.8549
DBT/DBTS Ratios by Site

This scatterplot visualizes the DBT/DBTS ratios with ambient temperature

All Ratios and Ozone Concentrations

So, to Summarize thus Far:
-DBT > DBTS and vary by site.
-Ratios of DBT/DBTS not statistically different between sites
-DBT and DBTS are correlated and statistically associated.
-Controlling for ambient temperature does not change this association by much.
-There may be a slight decrease in ratio with increasing temperature
All Field and Method Blanks for active samples were zero and so they may not be used to inform this analysis. However, we could look into the laboratory control standards.
~ 30 active samples per year. We are able to look for covariation among pollutants. Groups of covarying pollutants, where the groups themselves are NOT correlated, are called principal components. If DBT and DBTS co-vary in isolation from other pollutants, this would provide information that would suggest that they either have one unique source or one could be generated from the other. PCA is a hypothesis generation tool.
Correlation matrix of the First Study Year Dataset

Scree plots indicate how many groups of covarying analytes there may be.

3 components form. Molecular Weight a driver. Disappointing.

Since gas_particle phase is such a driver, let's look at gas phase alone

Scree plots indicates 4 components.

Now we see the thiophenes and mid-weight PAHs, volatile PAHs including anthrancene, the benzo[b,j,k]fluoranthenes, and retene_benzo(c)fluorene_pyrene

Next we will look at the passive results. These samplers are out in the field for a longer period of time.This could allow for more DBTS to form if DBTS is generated on the XAD and not an emissions source.
However, there are not enough passive samples collected over time to look for temporal correlations (PCA) similar to the active samples.
Similar to the active results, all of the passive field and method blanks are below detection. However, we can look into the laboratory control standards.
First we test for a statistical association between DBT and DBTS

Is the relationship between DBT and DBTS statistically significant?
## [1] "NonParametric Correlation Coefficient Using Kendall Tau Pairwise Comparison = 0.4"
What variability of DBT can be attributed to DBTS?
##    Parameters DBT_DBTS_Temperature_Results
## 1 X-Intercept                    -3.16e-03
## 2       Slope                     2.02e-01
## 3     p value                     1.32e-18
## 4   r squared                     8.11e-01
We do not yet have ambient temperatures associated with the Passive Results
Let's look at the ratios of passive DBT vs passive DBTS

Now let's compare active and passive ratios of DBT vs DBTS

What about the Ratio Differences between Active and Passive samples?

DBT and DBTS Concentration Differences among Sites
##
##  Kruskal-Wallis rank sum test
##
## data:  Dibenzothiophene by as.factor(Monitor_ID)
## Kruskal-Wallis chi-squared = 22.5, df = 16, p-value = 0.1287
##
##  Kruskal-Wallis rank sum test
##
## data:  Dibenzothiophene_sulfone by as.factor(Monitor_ID)
## Kruskal-Wallis chi-squared = 21.4, df = 16, p-value = 0.1639
The concentrations are not different, are the Ratios?
##
##  Kruskal-Wallis rank sum test
##
## data:  Ratio by as.factor(Monitor_ID)
## Kruskal-Wallis chi-squared = 16.6, df = 16, p-value = 0.4104
Finally, are the Ratios calculated from Active and Passive Samples Statistically Different?
## [1] "Means Comparison between ratios (DBT/DBTS) by Sampler Type"
##
##  Kruskal-Wallis rank sum test
##
## data:  Ratio by as.factor(SampleType)
## Kruskal-Wallis chi-squared = 13.5, df = 1, p-value = 0.0002327
Summary:
-Many PAHs are correlated with one another
-Gas phase PAHs form 4 principal components that explain over 10% of the data variability each including: the thiophenes and mid-weight PAHs, and the volatile PAHs including anthrancene, the benzo[b,j,k]fluoranthenes, and retene on its own.
-DBT and DBTS are also statistically associated in passive samples, with ~86% of the variability of DBT explained by DBTS
-The ratios of DBT and DBTS are more variable between sites than the active sample ratios (need more analyzed data)
-Over all, to this point, the central tendencies of the ratios are not different active vs passive (this could change)