Hướng dẫn vẽ khối lập phương trong R
Duc Nguyen | Chuyên đào tạo kỹ năng R |
www.tuhocr.com
July 13, 2023
Các bạn sử dụng package isocubes để vẽ hình lập
phương nhé. Tuy nhiên để tô màu cả 3 mặt của hình lập phương ta cần
modify một chút để đảm bảo hình vẽ đúng yêu cầu.
Link download package
https://github.com/coolbutuseless/isocubes
visible_cubes <- function (coords)
{
rev(!duplicated(rev((coords$x - coords$z) * 1024L + ((coords$x +
coords$z) * 0.5 + coords$y))))
}
ve_cube <- function (coords, fill = "grey90", fill2 = NULL, fill3 = NULL,
light = "top-left", ysize = 1/20, xo = 0.5, yo = ysize, verbose = FALSE,
...)
{
if (nrow(coords) == 0) {
return(grid::nullGrob())
}
sf <- 1/ysize
coords$x <- as.integer(round(coords$x))
coords$y <- as.integer(round(coords$y))
coords$z <- as.integer(round(coords$z))
sort_order <- with(coords, order(-x, -z, y))
coords <- coords[sort_order, ]
Norig <- nrow(coords)
visible <- visible_cubes(coords)
if (verbose)
message("Visible cubes: ", sum(visible), " / ", nrow(coords))
coords <- coords[visible, ]
if (length(fill) == 1) {
fill <- rep(fill, Norig)
}
else if (length(fill) != Norig) {
stop("'fill' must be length = 1 or N")
}
fill <- fill[sort_order]
fill <- fill[visible]
N <- nrow(coords)
if (is.null(fill2)) {
fill2 <- cheap_darken(fill, 0.3)
}
else {
if (length(fill2) == 1) {
fill2 <- rep(fill2, Norig)
}
else if (length(fill2) != Norig) {
stop("'fill2' must be length = 1 or ", N, ", not ",
length(fill2))
}
fill2 <- fill2[sort_order]
fill2 <- fill2[visible]
}
if (is.null(fill3)) {
fill3 <- cheap_darken(fill, 0.6)
}
else {
if (length(fill3) == 1) {
fill3 <- rep(fill3, Norig)
}
else if (length(fill3) != Norig) {
stop("'fill3' must be length = 1 or N")
}
fill3 <- fill3[sort_order]
fill3 <- fill3[visible]
}
colors <- switch(light, `top-left` = as.vector(rbind(fill,
fill2, fill3)), `top-right` = as.vector(rbind(fill, fill3,
fill2)), `left-top` = as.vector(rbind(fill2, fill, fill3)),
`left-right` = as.vector(rbind(fill3, fill, fill2)),
`right-top` = as.vector(rbind(fill2, fill3, fill)), `right-left` = as.vector(rbind(fill3,
fill2, fill)), stop("'light' argument is not valid: ",
light))
theta <- seq(90, 390, 60) * pi/180
x <- cos(theta)
y <- sin(theta)
xall <- c(x[1], x[2], 0, x[6], x[2], x[3], x[4], 0, x[4],
x[5], x[6], 0)/sf + xo
yall <- c(y[1], y[2], 0, y[6], y[2], y[3], y[4], 0, y[4],
y[5], y[6], 0)/sf + yo
ix <- 1/sf * ((coords$x - coords$z) * cos(pi/6))
iy <- 1/sf * ((coords$x + coords$z) * sin(pi/6) + coords$y)
gp <- gpar(...)
gp$fill <- colors
cube <- polygonGrob(x = xall + rep(ix, each = 12), y = yall +
rep(iy, each = 12), id.lengths = rep(4, 3 * N), default.units = "snpc",
gp = gp)
cube
}Vẽ khối lập phương
library(grid)
library(purrr)
library(isocubes)
library(png)
source("ve_cube.R")
# x11(width = 1000, height = 1000)
library(Cairo)
Cairo::CairoPNG(
width = 4000,
height = 4000,
file = "cube_1millioni.png",
bg = "grey95",
dpi = 300,
units = "px"
)
set.seed(1)
N <- 100
ysize <- 1/220
coords <- expand.grid(x = 1:N, y = 1:N, z = 1:N)
cubes <- ve_cube(coords,
# fill = fill,
fill = '#ff71ce',
fill2 = '#05ffa1',
fill3 = '#01cdfe',
ysize = ysize,
xo = 0.55,
yo = 1/40,
lwd = 0.5)
# grid.newpage()
# grid.draw(cubes)
n_1 <- 3
ysize_1 <- 1/220
coords_1 <- expand.grid(x = 1:n_1, y = 1:n_1, z = 1:n_1)
cubes_1 <- ve_cube(coords_1,
# fill = fill,
fill = 'yellow',
fill2 = 'coral',
fill3 = 'aquamarine',
ysize = ysize,
xo = 0.85,
yo = 0.83,
lwd = 0.5)
grid.newpage()
grid.draw(cubes)
grid.draw(cubes_1)
grid.text("CPU máy tính cá nhân rất mạnh có thể đạt 9 GHz ~ \ntương đương 9 tỷ phép tính trên 1 giây ~ \ntượng trưng 9 khối hình vuông nhỏ.",
x = 0.80, y = 0.92 ,
gp = gpar(fontsize = 15, col = "blue"))
grid.text("Hình vuông này gồm 1 triệu khối nhỏ hơn.\nNếu mỗi hình vuông nhỏ là 1 tỷ,\nthì toàn bộ là 1 triệu tỷ, hay là 1 quadrillion \ntức là 1000 trillion phép tính trên 1 giây.\nĐây là sức mạnh siêu máy tính vào \nnhững năm 2010s, giờ đây siêu máy tính \nđã đạt hơn 100 quadrillion, hay là\n100 khối hình vuông to như vậy.",
x = 0.18, y = 0.88,
gp = gpar(fontsize = 15, col = "blue"))
grid.text("Home PC vs Super Computer",
x = 0.2, y = 0.1,
gp = gpar(fontsize = 25, col = "red2"))
grid.text("Minh họa: Duc Nguyen | tuhocr.com",
x = 0.82, y = 0.045,
gp = gpar(fontsize = 16, col = "black"))
logor <- readPNG("logo-blue.png")
grid.raster(logor, x = 0.87, y = 0.12, width = 0.15)
dev.off()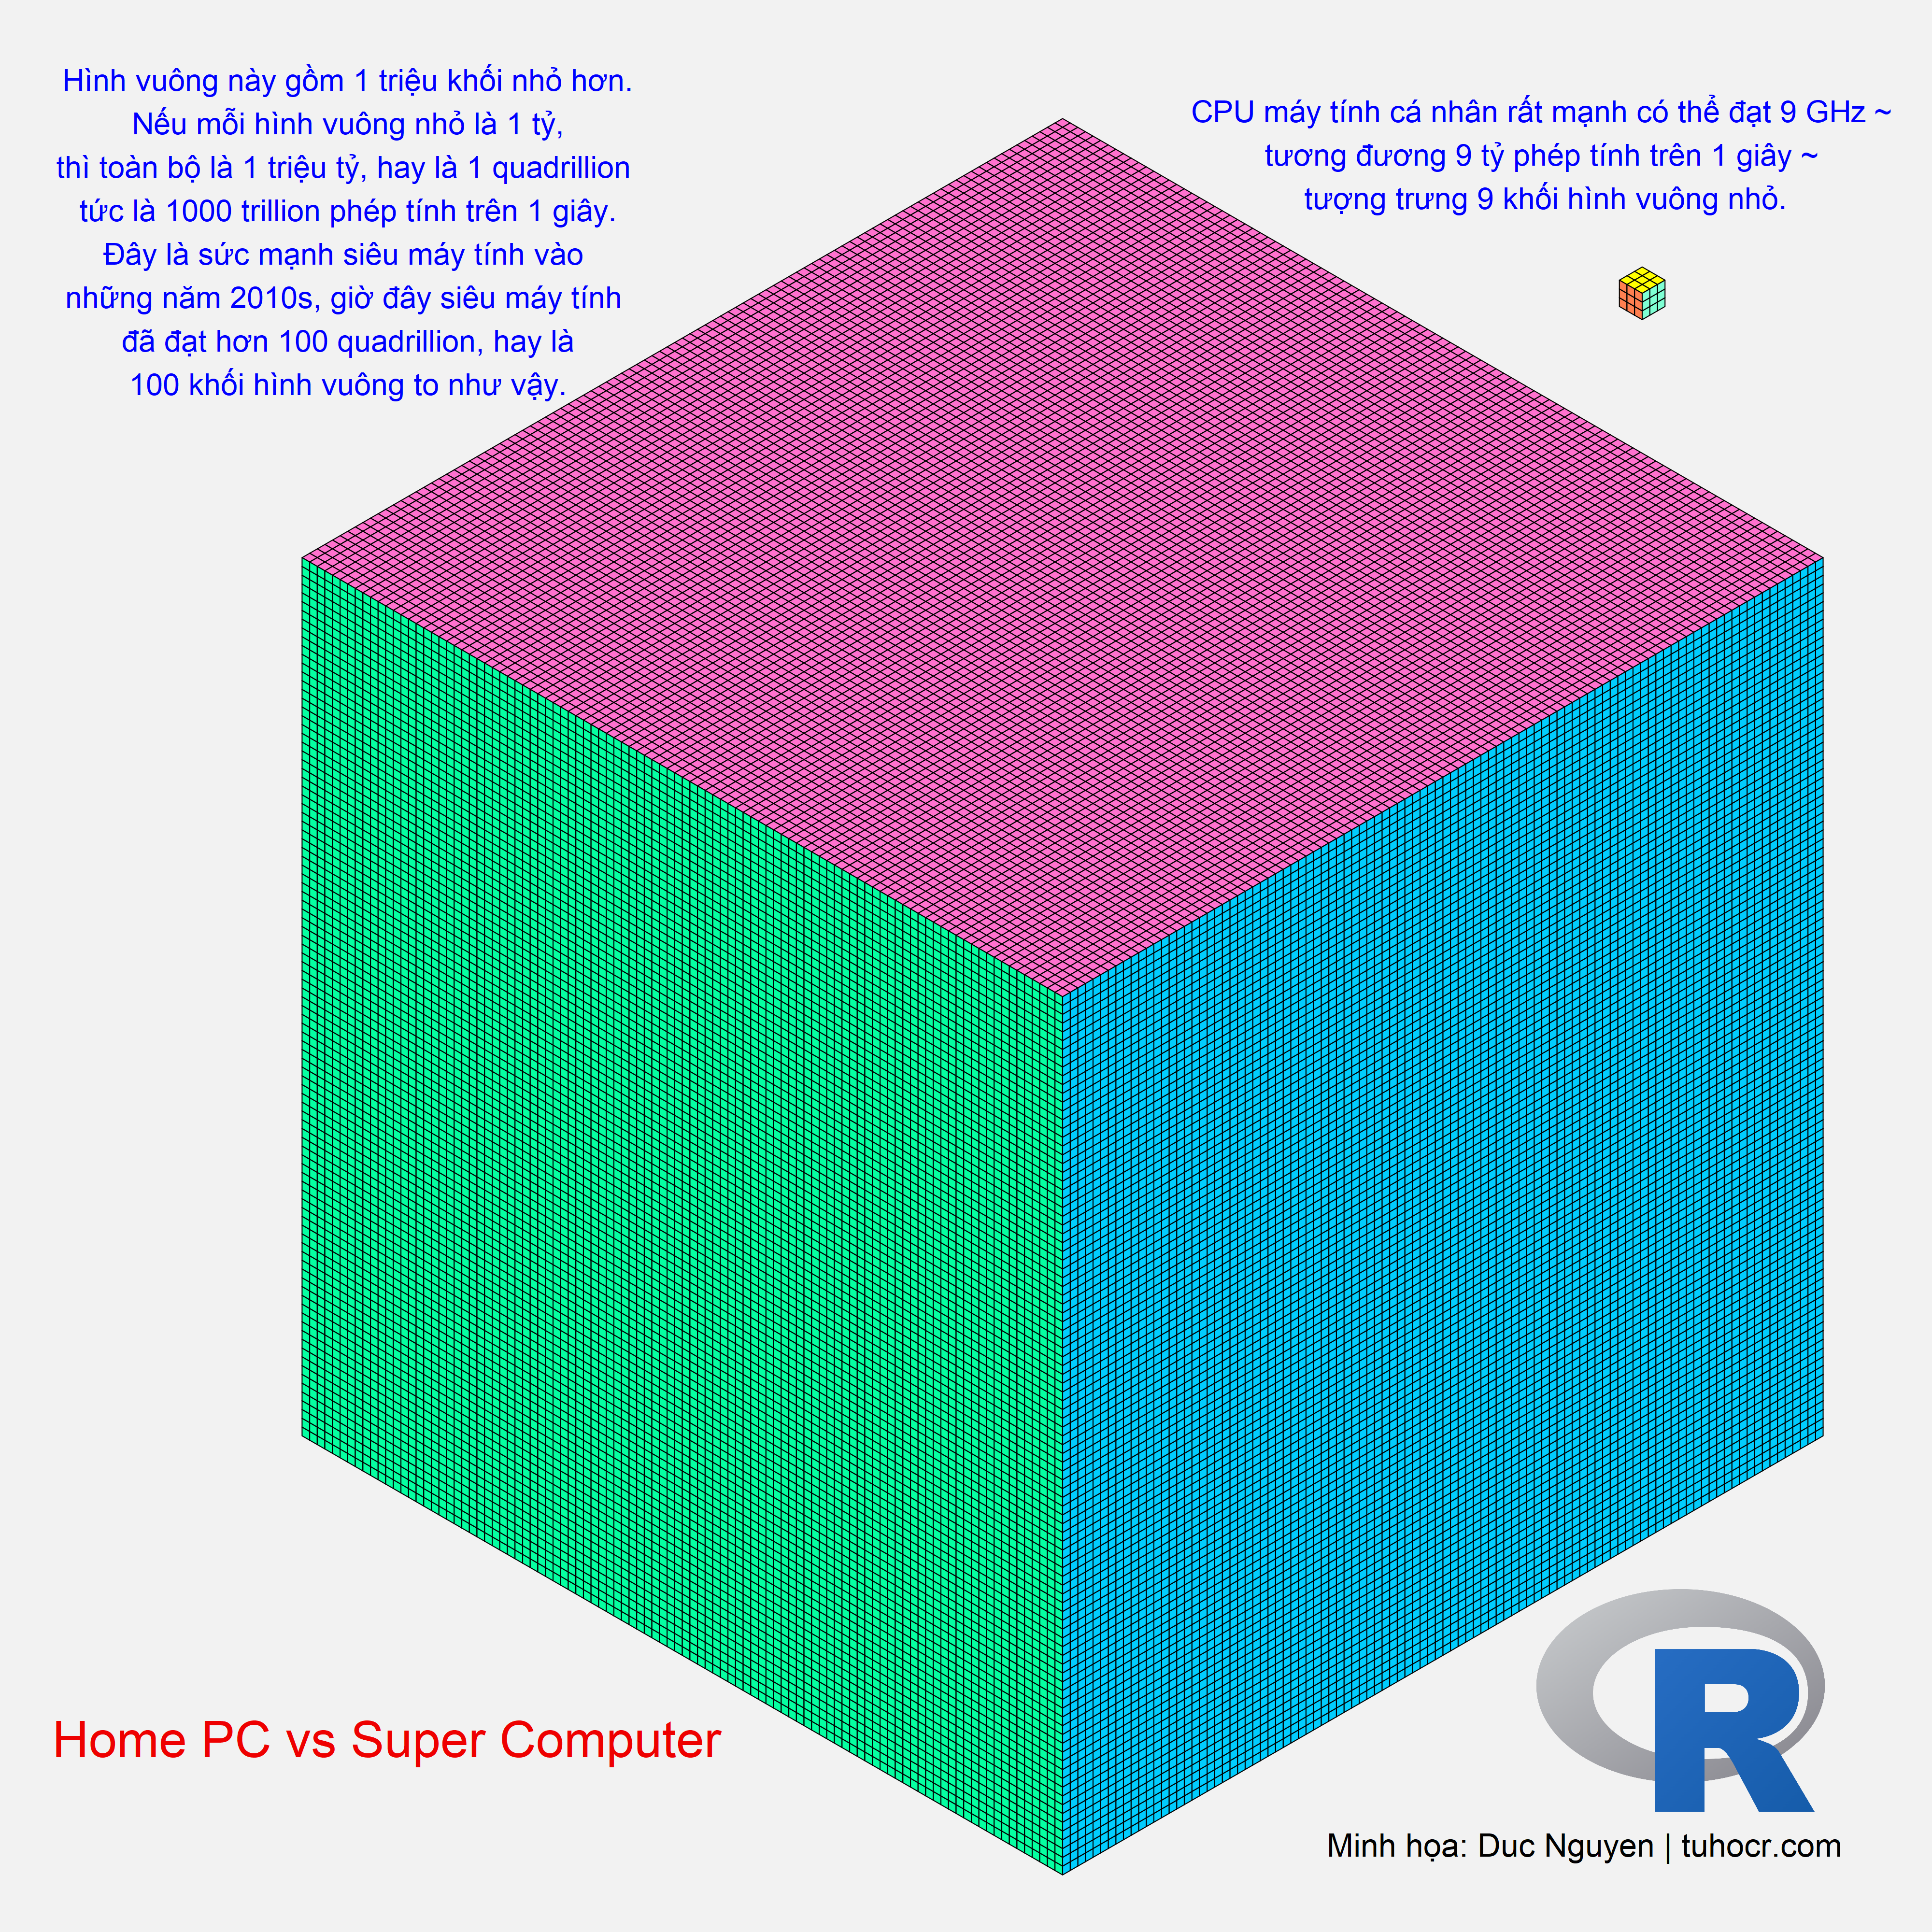
https://tuhocr.netlify.app/cube_1million.png
knitr::include_graphics("cube_1million.png")
Tài liệu tham khảo
https://www.netapp.com/data-storage/high-performance-computing/what-is-hpc/https://www.mathsisfun.com/metric-numbers.htmlhttps://en.wikipedia.org/wiki/Supercomputerhttps://www.thegioididong.com/tin-tuc/ky-luc-ep-xung-da-bi-pha-vo-bang-intel-core-i9-13900k-1498451
Sơ kết
Trên đây là hướng dẫn vẽ khối lập phương trong R. Để học R bài bản từ A đến Z, thân mời Bạn tham gia khóa học “HDSD R để xử lý dữ liệu” để có nền tảng vững chắc về R nhằm tự tay làm các câu chuyện dữ liệu của riêng mình!
ĐĂNG KÝ NGAY:
https://www.tuhocr.com/register
